
Fig. 22.
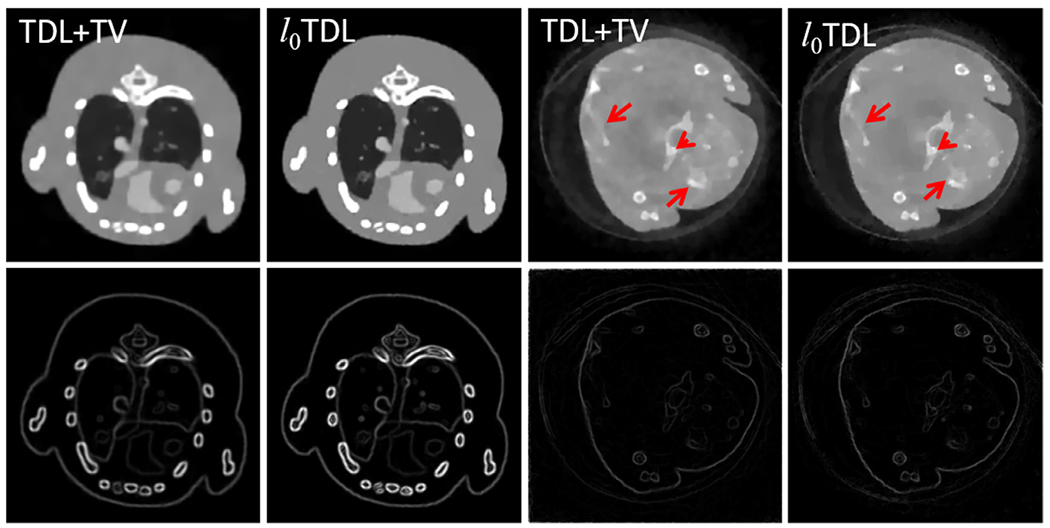
The first two columns represent the reconstructed and corresponding gradient images from the 4th channel of numerically simulated mouse dataset using the TDL and ℓ0TDL methods. The display window of the reconstructed image is [0, 0.8] cm−1. The last two columns are the same as the first two columns but from the 13th channel of the realistic dataset and the display window of gradient images is [0, 0.4] cm−1.