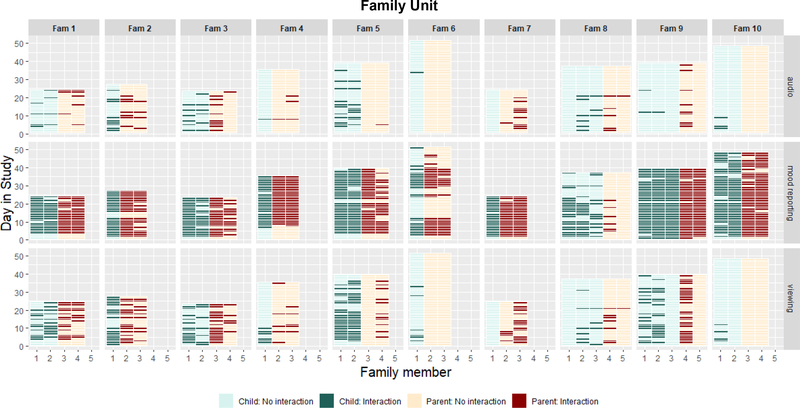
Figure 7.
Heatmap of interactions for each family. Rows represent the type of interaction (from top to bottom): audio reflection, mood reporting, and views. Each column represents a family, from right to left, Fam 1 represents Family F1 to Fam 10 representing Family10. The x-axis in each family column represents family members and the y-axis represents the day of the study. Dark green bars represent the days on which children interacted, light green represents days children did not interact, dark red represents days parents interacted, and light red represents days parents did not interact.

