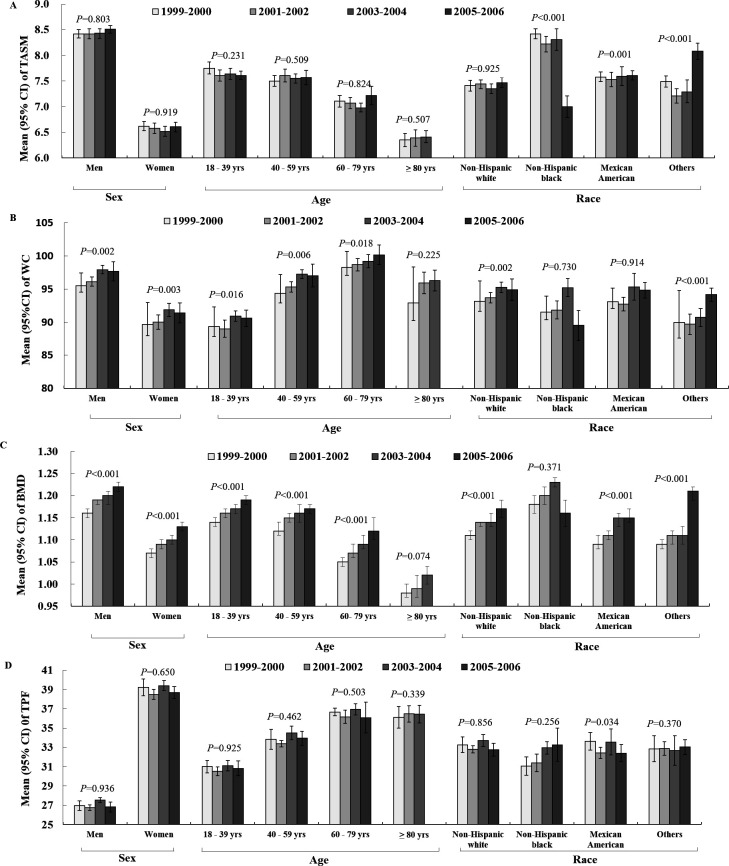
Figure 2.
Distribution of body composition measurements, including SMI (A), WC (B), BMD (C) and TPF (D), by sex, age and racial group from 1999 to 2006. 95% CI. P values refer to temporal trends obtained by logistic regression models after adjusting for sex, age, race, education level, annual household income, time spent watching TV per day and physical activity level. BMD, bone mineral density; SMI, Skeletal Muscle Index; TASM, total appendicular skeletal muscle; TPF, total percentage of body fat; TV, television; WC, waist circumstance.

