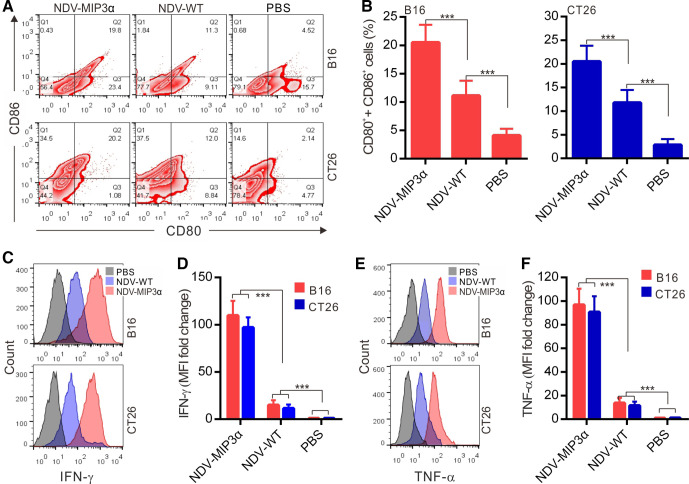
Figure 3.
NDV-MIP3α infection promotes DC maturation and activation. mDCs were cultured with the supernatants (50 µL at 48 hours) from B16 or CT26 tumor cells infected with NDV-MIP3α (1 MOI) or NDV-WT (1 MOI), or treated with PBS only for 24 hours. (A) The representative images from FCM analysis of CD80+ and CD86+ double-positive cells and (B) data of four independent experiments. (C) The representative images of secreting IFN-γ-secreting cells detected by FCM and (D) data of four independent experiments show the MFI fold change normalized to the data of PBS-treated group that is shown as onefold (d). (E) The representative images of secreting TNF-α-secreting cells detected by FCM and (F) data of four independent experiments show the MFI fold change. Data are plotted as mean±SD, ***p<0.001. CRT, calreticulin; DCs, dendritic cells; FCM, flow cytometry; MFI, mean fluorescence intensity. MIP-3α, macrophage inflammatory protein-3α; MOI, multiplicity of infection; NDV, Newcastle disease virus; NDV-WT, wild-type NDV; PBS, phosphate buffer saline.

