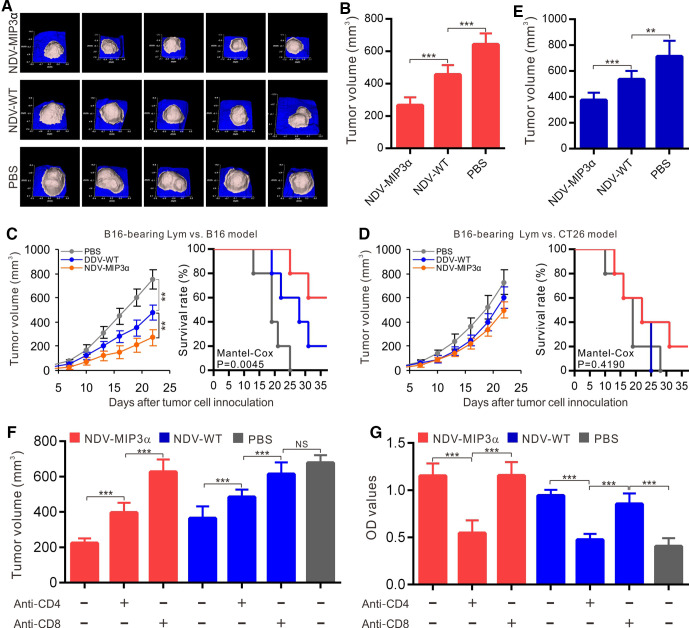
Figure 6.
Antitumor activities by adoptive transfer of splenocytes and antibodies, and the role of T cells. (A and B) Adoptive transfer of splenocytes from B16-bearing mice treated with the indicated formulations to the recipient syngeneic B16-bearing mice (n=5). Data show the tumor images (A) and tumor volume (B) on day 18 after tumor cell challenge. (C) Adoptive transfer of splenocytes from the mice treated with indicated formulations to the recipient syngeneic B16-bearing mice (n=5). Data show the tumor volumes and survival rates at the indicated time points. (D) Adoptive transfer of splenocytes from the B16-bearing mice treated with indicated formulations to the recipient heterogeneic CT26-bearing mice (n=5). Data show the tumor volumes and survival rates at the indicated time points. (E) Adoptive transfer of antibodies (50 mg/kg) from mice treated with indicated formulations to recipient syngeneic B16-bearing mice (n=5). Data showed the tumor volumes on day 18. (F) The CD4 or CD8 T-cell subsets depleted by intraperitoneal injection of mAb (50 mg/kg per mouse) into B16-bearing mice treated with the indicated NDV or PBS. The data show the tumor volume on day 18 after tumor cell injection. (G) The CD4 or CD8 T-cell subsets depleted by injection of mAb in B16-bearing mice treated with the indicated NDV or PBS; the data show the titers of IgG antibodies in sera of B16-bearing mice on day 18 after tumor cell inoculation by ELISA. Data are plotted as mean±SD, **p<0.01, ***p<0.001. mAb, monoclonal antibodies; MIP-3α, macrophage inflammatory protein-3α; NDV, Newcastle disease virus; NDV-WT, wild-type NDV.

