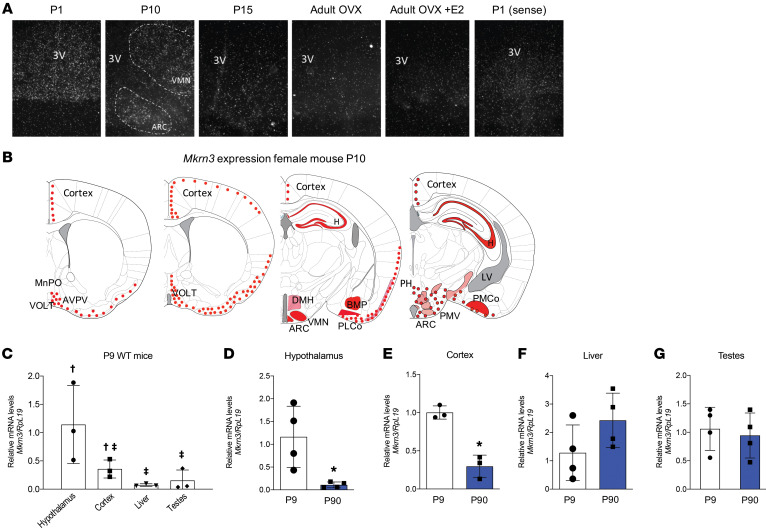
Figure 3. Mkrn3 expression is higher in the hypothalamus and cortex of mice compared with peripheral tissues before puberty onset.
(A) Representative photomicrographs showing Mkrn3 expression by in situ hybridization (ISH) in female mice in the caudal hypothalamus. A high, diffuse level of Mkrn3 expression was detected in the hypothalamus of P1 mice, with more specific localization of expression in the ARC and VMN at P10. Expression was reduced by P15 and low in the adult in both ovariectomized (OVX) and estradiol-replaced (E2-replaced) mice. A sense probe did not detect Mkrn3 mRNA. 3V, third ventricle; ARC, arcuate nucleus; VMN, ventromedial nucleus. (B) Schematic representation of the neuroanatomical distribution of Mkrn3 mRNA in the brain of female P10 mice, as assessed by ISH. Red dots indicate areas where Mkrn3 mRNA was detected, darker areas with higher concentrations, and lighter red with relatively low Mkrn3 expression. MnPo, median preoptic nucleus; VOLT, vascular organ of the lamina terminalis; H, hippocampus; DMH, dorsomedial nucleus of hypothalamus; PLCo, posterolateral cortical amygdaloid nucleus; BMP, accessory basal amygdaloid nucleus; PH, posterior hypothalamic area; PMV, premammillary nucleus, ventral part; PMCo, posteromedial cortical amygdaloid nucleus; LV, lateral ventricle. (C) Mkrn3 expression in tissues of P9 male mice. (D–G) Mkrn3 expression in the hypothalamus (D), cortex (E), liver (F), and testes (G) of mice at P9 (white bar) and P90 (blue bar). The bar graphs show the relative change in mRNA levels in different tissues, compared with Mkrn3 levels in the hypothalamus in C and with levels at P9 in D–G. Mean (±SEM) values are shown at each age (n = 3–4 mice per group, with each measurement performed in triplicate). In C, groups with different symbols (†, ‡) are significantly different (P = 0.039), as determined by 1-way ANOVA followed by Tukey’s multiple-comparisons test. In D–G, statistical analysis was performed by unpaired 2-tailed t test. Asterisks indicate P = 0.002 in D and P = 0.02 in E.

