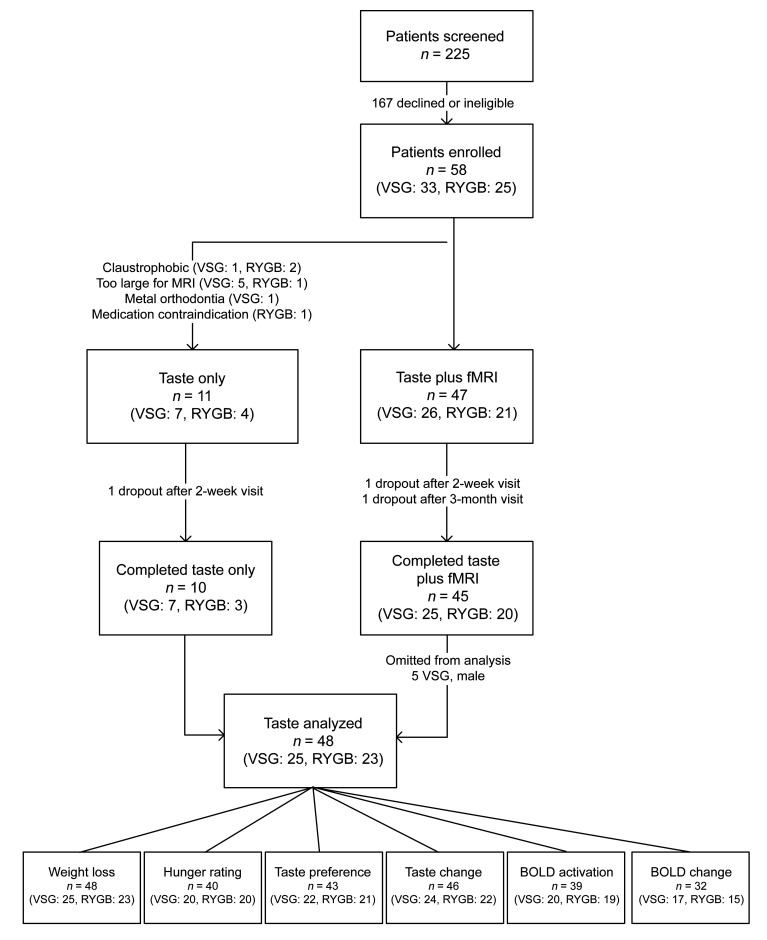
Figure 1. Flow diagram of patient recruitment, enrollment, and participation.
Diagram depicts participant flow through the study process from patient screening to data analysis. The bottom panel represents number of subjects analyzed for each of 6 outcomes. “Weight loss” refers to %TWL, %EWL, and change in BMI and includes all participants. “Hunger ratings” includes subjects that had hunger ratings documented at all 4 visits. “Taste preference” refers to changes in taste preferences between surgical groups across time and includes subjects completing all 4 taste-preference visits. “Taste change” refers to associations between changes in taste at 2 weeks following surgery and 6-month weight loss and includes subjects completing preoperative and 2-week postoperative visits with preoperative and 6-month weights. “BOLD activation” refers to associations between preoperative BOLD activation and 6-month weight loss and includes subjects with baseline/preoperative fMRI data and preoperative and 6-month weights. “BOLD change” refers to associations between 2-week postoperative BOLD activation from baseline/preoperative and 6-month weight loss and includes subjects with fMRI data at baseline/preoperative and 2 weeks following surgery and preoperative and 6-month weights.

