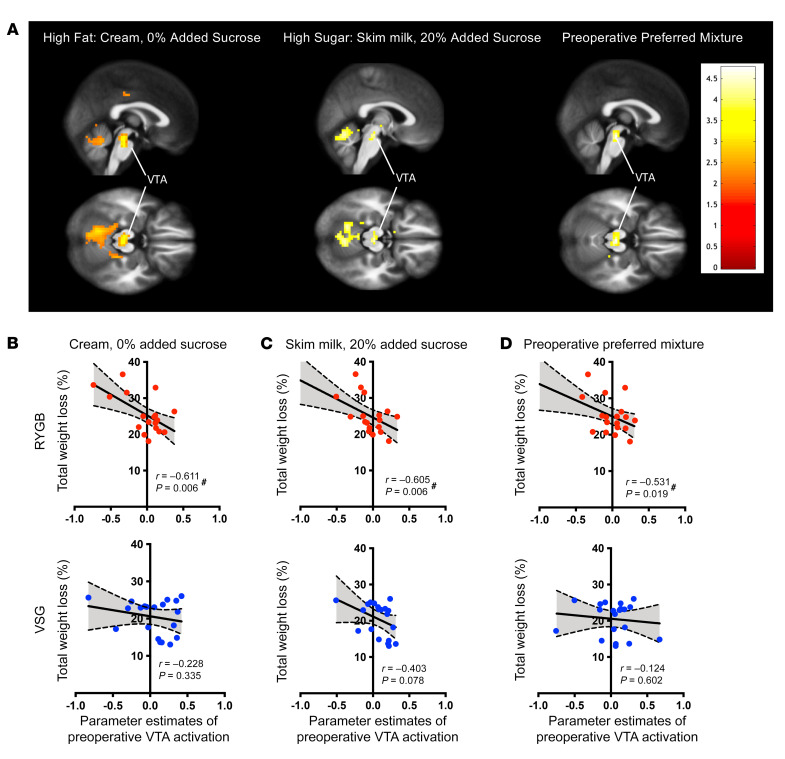
Figure 4. Preoperative activation in the VTA to taste mixtures predicts 6-month weight loss following RYGB.
(A) Maps depicting areas within VTA ROI showing negative correlation between baseline activation to the high-fat (cream, 0% added sucrose), high-sucrose (skim milk, 20% added sucrose), and preoperative preferred mixtures and weight loss at 6 months in RYGB patients. (B–D) Bivariate correlations demonstrating the relationship between preoperative VTA activation in response to the (B) high-fat, (C) high-sucrose, and (D) most preferred preoperative mixtures and 6-month weight loss following bariatric surgery. Activation in the VTA at baseline to these mixtures presented in the scanner correlated with %TWL at 6 months following RYGB (red, n = 19), but not VSG (blue, n = 20). #Significant bivariate correlations.

