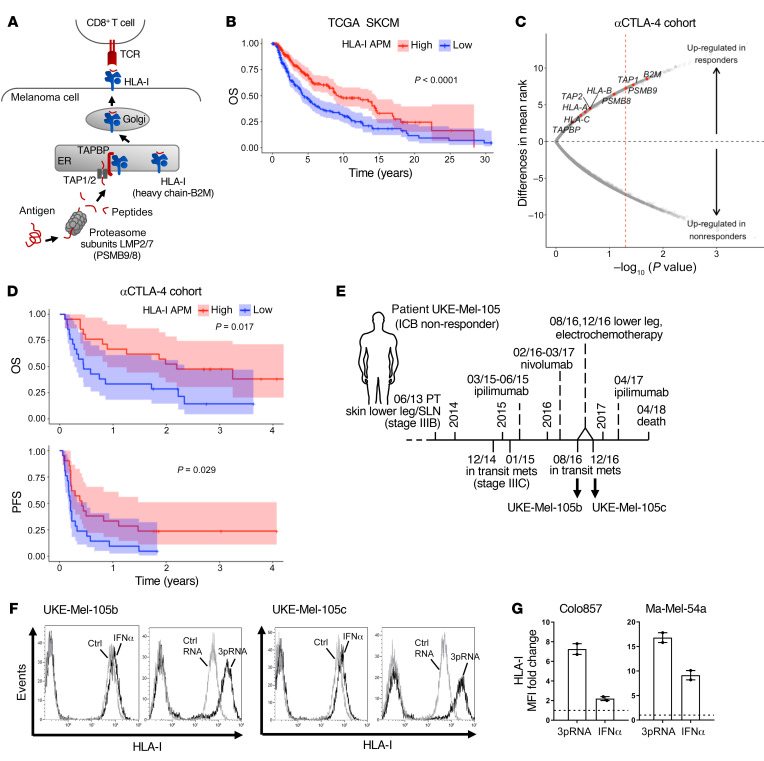
Figure 1. Low HLA-I APM expression correlates with nonresponsiveness to anti–CTLA-4 therapy and poor clinical outcome.
(A) Schematic representation of HLA-I APM components. (B) Overall survival (OS) in the TCGA SKCM cohort (n = 462) stratified by high and low HLA-I APM (HLA-A, HLA-B, HLA-C, B2M, LMP2, LMP7, TAP1, TAP2, TAPBP) expression relative to the median, log-rank test. (C and D) Clinical relevance of altered HLA-I APM expression in an anti–CTLA-4–treated (αCTLA-4–treated) patient cohort (30). (C) Volcano plot showing overall upregulation of HLA-I APM genes in clinical responders (n = 14) versus nonresponders (n = 23) in the αCTLA-4–treated cohort. The x axis is the negative log10 value of the Mann-Whitney U P value; the y axis is the difference in mean rank between response groups. Red vertical dashed line, unadjusted P value of 0.05. (D) Kaplan-Meier survival curves of OS and PFS of high (n = 21) and low (n = 21) HLA-I APM expression groups, log-rank test. High and low expression groups were classified relative to the median HLA-I APM expression level in the entire cohort. (E) Clinical history of melanoma patient UKE-Mel-105 (ICB nonresponder). Horizontal line, time axis; above: diagnosis, therapeutic regimens, death; below: metastases development; arrows indicate cell lines established from metastases UKE-Mel-105b and UKE-Mel-105c. (F and G) Melanoma cells were transfected with 3pRNA, control (ctrl) RNA, or treated with IFNα-2a (IFNα) and subjected to further analysis following an incubation of 20 to 24 hours. HLA-I surface expression was measured by flow cytometry. (F) Representative histograms for UKE-Mel-105b and UKE-Mel-105c cells from 3 independent experiments. (G) HLA-I expression on Colo857 and Ma-Mel-54a melanoma cells. Relative MFI given as mean plus SEM, 2 independent experiments.

