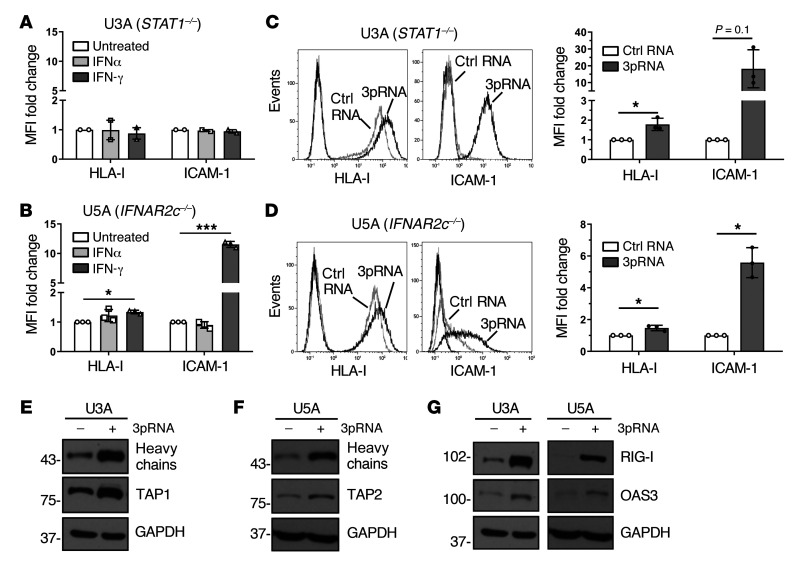
Figure 3. RIG-I upregulates HLA-I APM expression in IFN-I–resistant tumor cells.
(A and B) Human fibrosarcoma cells U3A (STAT1–/–) (A) and U5A (IFNAR2c–/–) (B) were treated with IFNα or IFN-γ for 20 to 24 hours. Controls were left untreated. HLA-I and ICAM-1 surface expression was determined by flow cytometry. Relative MFI given as mean plus SEM of 2 (A) and 3 (B) independent experiments. (C–G) U3A and U5A cells were transfected with 3pRNA or control (ctrl) RNA and subjected to further analyses following an incubation of 20 to 24 hours. (C and D) HLA-I and ICAM-1 surface expression of U3A (C) and U5A (D) cells measured by flow cytometry. Left, representative histogram; right, relative MFI given as mean plus SEM from 3 independent experiments. (E and F) HLA-I APM component expression in U3A (E) and U5A (F) cells analyzed by immunoblot. GAPDH, loading control. Representative data from 3 independent experiments. (G) RIG-I and OAS3 expression in U3A and U5A cells determined by immunoblot. GAPDH, loading control. Representative data from 3 independent experiments. Significantly different experimental groups: *P < 0.05, ***P < 0.005 by 2-tailed paired t test.

