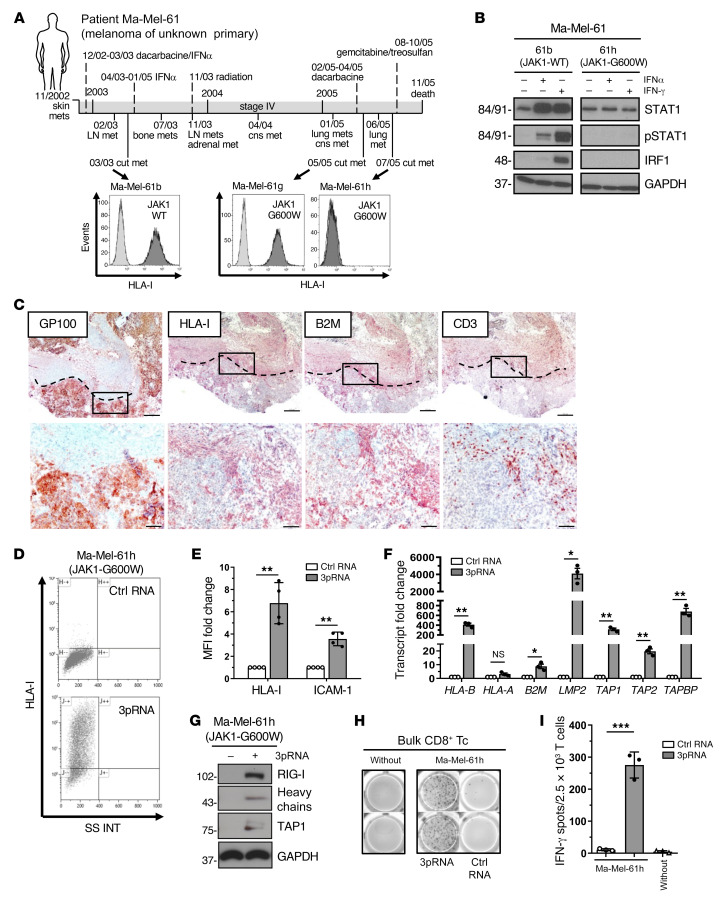
Figure 5. Targeted RIG-I activation overcomes HLA-I APM silencing in IFN-I–resistant melanoma cells and restores T cell sensitivity.
(A) Clinical history of melanoma patient Ma-Mel-61. Horizontal line, time axis; above: diagnosis, therapeutic regimens, death; below: metastases development; arrows indicate cell lines established from metastases Ma-Mel-61b (JAK1-wildtype, JAK1-WT), Ma-Mel-61g (JAK1-mutant, JAK1-G600W) and Ma-Mel-61h (JAK1-mutant, JAK1-G600W). HLA-I surface expression on cell lines established from corresponding lesions was determined by flow cytometry. Representative histograms from 3 independent experiments. (B) Cell lines treated with IFNα-2b or IFN-γ for 48 hours were analyzed for (p)STAT1 and IRF1 expression by immunoblot. GAPDH, loading control. Representative data from 3 independent experiments. (C) Immunohistochemical staining of serial cryostat tissue sections from metastasis Ma-Mel-61g for melanoma marker GP100, HLA-I, B2M, and CD3. Top, tumor margin indicated by the dotted line; bottom, higher magnification of boxed regions; original magnifications: ×2.5 (top), ×10 (bottom). (D–I) Ma-Mel-61h cells were transfected with 3pRNA or control (ctrl) RNA and subjected to further analysis following an incubation of 20 to 24 hours. (D and E) HLA-I and ICAM-1 surface expression measured by flow cytometry. (D) Representative HLA-I dot plot and (E) relative MFI given as mean plus SEM from 3 independent experiments. (F) mRNA expression of APM components analyzed by qPCR. Relative expression given as mean plus SEM from 3 independent experiments. (G) Expression of indicated proteins analyzed by immunoblot. GAPDH, loading control. Representative data from 3 independent experiments. (H and I) Activation of autologous CD8+ T cells by Ma-Mel-61h cells determined by IFN-γ ELISpot assay. (H) Representative ELISpot, (I) mean IFN-γ spots (+ SEM) from 3 independent experiments. without, incubation of T cells without tumor cells. Significantly different experimental groups: *P < 0.05, **P < 0.01, ***P < 0.005 by 2-tailed paired t test.

