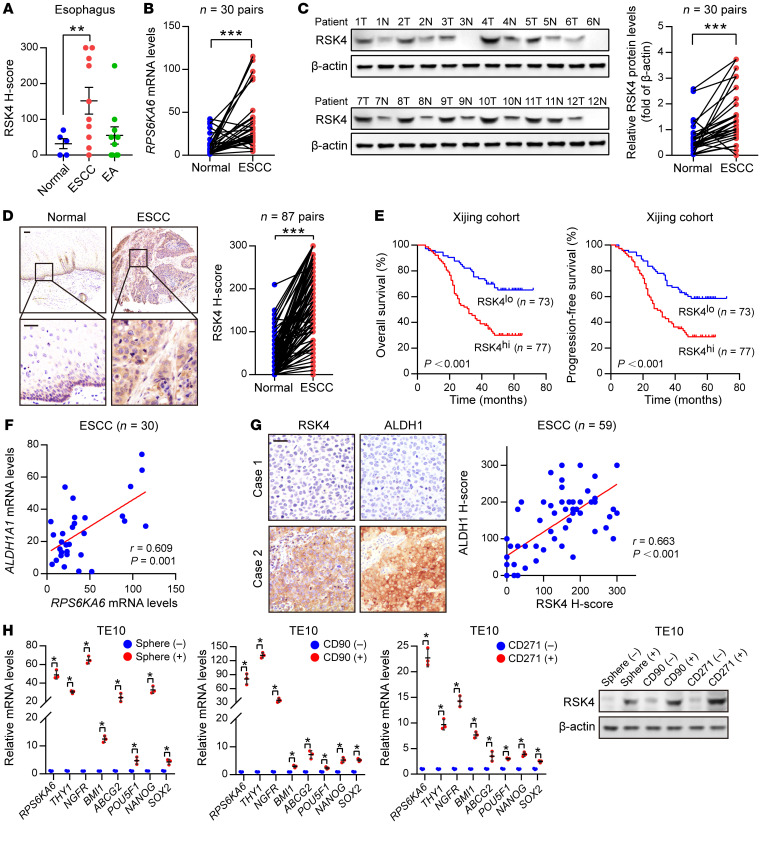
Figure 1. RSK4 is highly expressed in ESCC CSCs.
(A) RSK4 protein was highly expressed in ESCC rather than in esophageal adenocarcinoma (EA) compared with expression in corresponding nontumor tissues. Representative IHC images are shown in Supplemental Figure 1A. (B) mRNA levels of RPS6KA6 in 30 pairs of ESCC samples and adjacent nontumor tissues were determined by real-time PCR. GAPDH was used as a loading control. (C) Western blot analysis and quantification of RSK4 expression in ESCC tumor tissues (T) and adjacent nontumor tissues (N) from 30 patients. The results for the other samples are presented in Supplemental Figure 1B. Protein expression was normalized to β-actin levels. (D) Representative IHC images and H-score of RSK4 protein expression in ESCC tumor tissues and adjacent nontumor tissues. Scale bars: 100 μm. (E) Kaplan-Meier estimation of ESCC OS and PFS based on the RSK4 expression levels in the Xijing cohort. (F) Correlation between RPS6KA6 and ALDH1A1 mRNA expression in 30 ESCC patients. (G) Representative IHC images of RSK4 and ALDH1 protein expression in patients with ESCC from the Xijing cohort. Scale bars: 100 μm. Correlation of IHC data on RSK4 and ALDH1 protein expression in 59 ESCC patients. (H) RSK4 was preferentially expressed in tumor spheres compared with nonspheres, and elevated RSK4 expression was detected in CD90+- or CD271+-enriched cell populations compared with the CD90− or CD271− cell subsets as assessed by real-time PCR (n = 3 independent experiments) and immunoblotting. Data represent the mean ± SD. *P < 0.05, **P < 0.01, and ***P < 0.001. Differences were tested using a paired (B–D) and unpaired (H) 2-sided Student’s t test, 1-way ANOVA with Tukey’s post hoc test (A), and log-rank test (E). The correlation was determined by Pearson’s correlation test (F and G).

