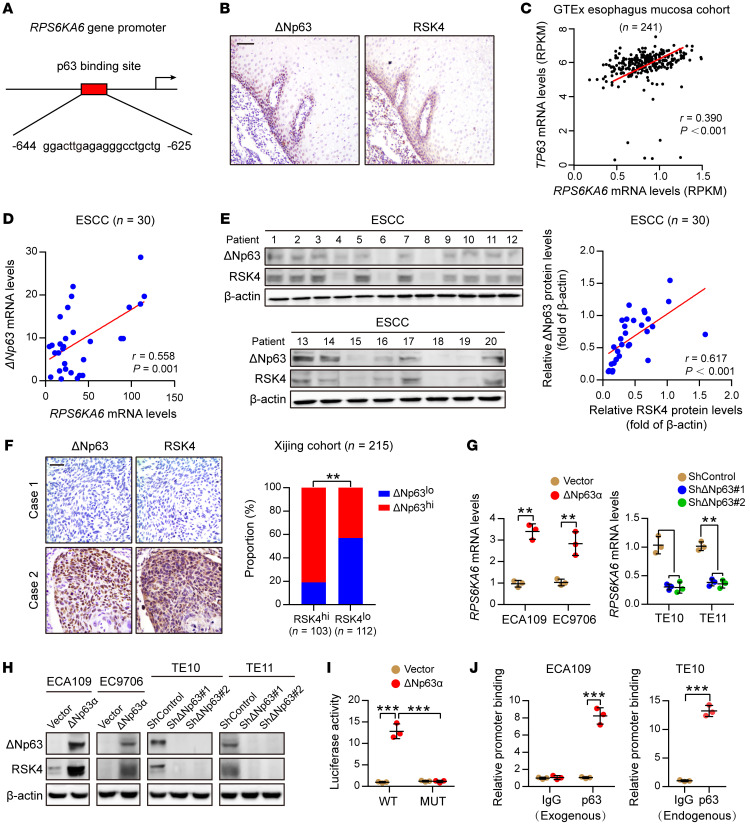
Figure 4. ΔNp63α directly transactivates RSK4 expression in ESCC.
(A) Predicted binding sites for p63 in the promoter regions of RPS6KA6. (B) IHC analysis of ΔNp63 and RSK4 proteins showing an identical coexpression pattern in serial sections of the esophageal epithelial basal and suprabasal layers. Scale bar: 50 μm. (C) Correlation between the RPS6KA6 and TP63 mRNA expression patterns in the GTEx esophagus mucosa data set. (D) mRNA levels of ΔNp63 and RPS6KA6 in 30 ESCC samples were determined by real-time PCR. GAPDH was used as a loading control. (E) Expression of ΔNp63 and RSK4 in 30 ESCC samples was detected by Western blotting. The results of other samples are presented in Supplemental Figure 3G. Protein expression was normalized to β-actin levels. (F) Representative IHC images of ΔNp63 and RSK4 protein expression in patients with ESCC. Scale bar: 100 μm. Histograms show the correlation of the IHC data for high or low RSK4 expression relative to the level of ΔNp63. (G) ΔNp63α overexpression upregulated, whereas ΔNp63 silencing reduced, RPS6KA6 mRNA expression in ESCC cells (n = 3 independent experiments). (H) ΔNp63α overexpression upregulated, whereas ΔNp63 silencing reduced, RSK4 protein expression in ESCC cells. (I) ΔNp63α induced reporter activity of the WT RPS6KA6 promoter rather than the p63 responsive element deletion mutant (MUT) promoter, as determined by a luciferase reporter assay in HEK293T cells (n = 3 independent experiments). (J) Exogenous and endogenous ChIP analysis of the interaction between ΔNp63 protein and the RPS6KA6 promoter in ESCC cells (n = 3 independent experiments). Data represent the mean ± SD. **P < 0.01 and ***P < 0.001. Differences were tested using an unpaired, 2-sided Student’s t test (G, I, and J) and a χ2 test (F). The correlation was determined by Pearson’s correlation test (C–E).

