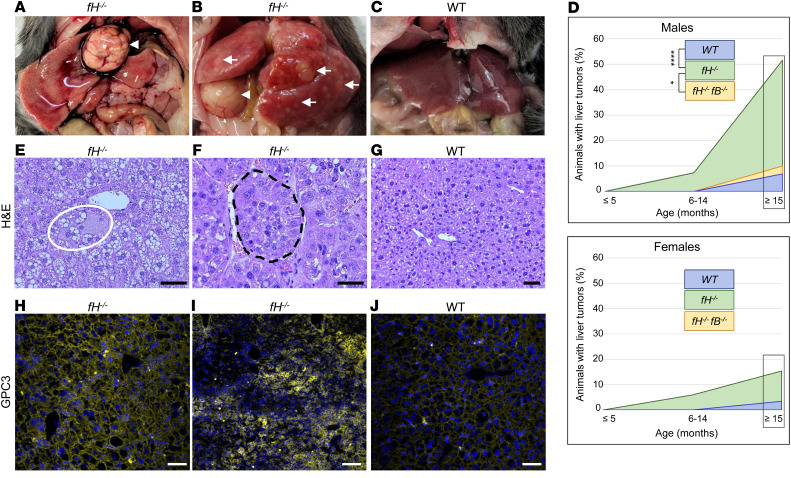
Figure 1. fH–/– mice spontaneously develop hepatic tumors.
(A–C) Necropsy images of large focal tumors (A and B, arrowheads) or multilobular tumors (B, arrows) in fH–/– livers. WT livers (C) are generally normal in appearance. (D) Of mice aged 15 months or older, 54% of fH–/– males had visible liver tumors compared with only 10% of fH–/–fB–/– and 7% of WT males. *P = 0.0271 and ****P < 0.0001, respectively; 2-sided Fisher’s exact test; fH–/– n = 35, WT n = 29, fH–/–fB–/– n = 10. Tumor incidence in fH–/– females aged 15 months or older was 15% compared with 0% in fH–/–fB–/– and 3% in WT mice. P = 0.5586 and P = 0.1777, respectively; 2-sided Fisher’s exact test; fH–/– n = 26, WT n = 29, and fH–/–fB–/– n = 10. (E–G) Hepatocyte ballooning (E) and tumor nests in 18-month-old fH–/– livers (F), and generally normal tissue in WT livers (G). Scale bars: 20 μm (E and F), 100 μm (G); n = 20 males (≥15 months) per group. (H–J) Membranous (H) and cytoplasmic (I) GPC3 deposition in fH–/– livers; punctate GPC3 in WT livers (J). Nuclei stained with DAPI (blue). Scale bars: 200 μm (H and J), 100 μm (I); n = 20 males (≥15 months) per group.

