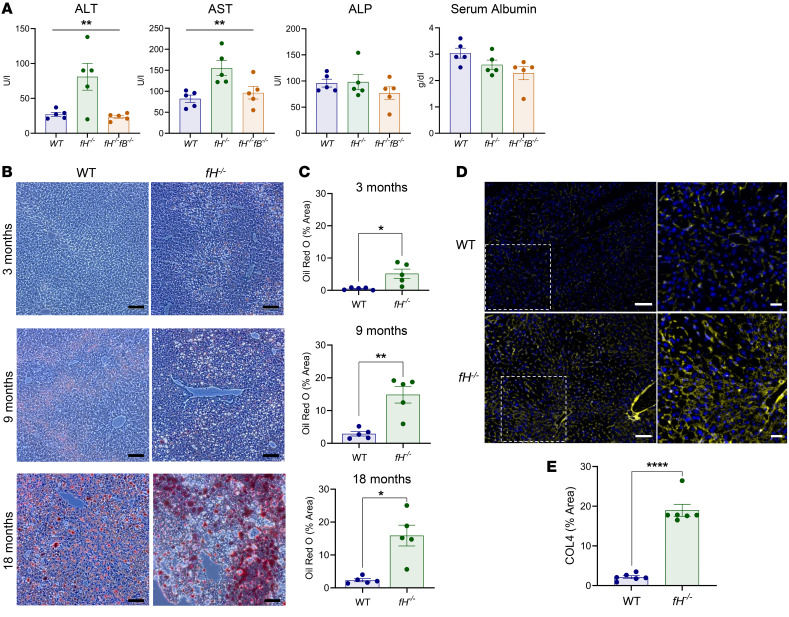
Figure 3. Hepatocellular injury in fH–/– mice.
(A) Elevated ALT and AST in fH–/– mice. **P < 0.001. ALT, F2, 12 = 8.199; AST, F2, 12 = 7.281; ALP, P = 0.3976; albumin, P = 0.0694; 1-way ANOVA with post hoc Tukey’s t test; mean ± SEM; n = 5 males (3 months) per group. (B and C) Zonal lipid accumulation shown by Oil Red O staining in fH–/– and WT livers at 3, 9, and 18 months. Scale bars: 100 μm. (C) Oil Red O quantification: ** P < 0.01, * P < 0.05; 3 months, t = 3.225, df = 4.106; 9 months, t = 4.556, df = 4.563; and 18 months, t = 4.255, df = 4.176; unpaired, 2-tailed t test with Welch’s correction; mean ± SEM; n = 5 males (each at 3, 9, and 18 months) per group. (D and E) COL4 deposition in WT (D, top) and fH–/– sinusoids (D, bottom). Nuclei stained with DAPI (blue). Images are representative of 4 independent experiments. Scale bars: 100 μm, inset 50 μm; n = 6 males (14 months) per group (E) COL4 quantification. ****P < 0.0001, t = 10.87, df = 5.563; unpaired, 2-tailed t test with Welch’s correction; mean ± SEM; n = 6 males (14 months) per group. ALT, alanine aminotransferase; AST, aspartate aminotransferase; ALP, alkaline phosphatase; COL4, collagen IV.

