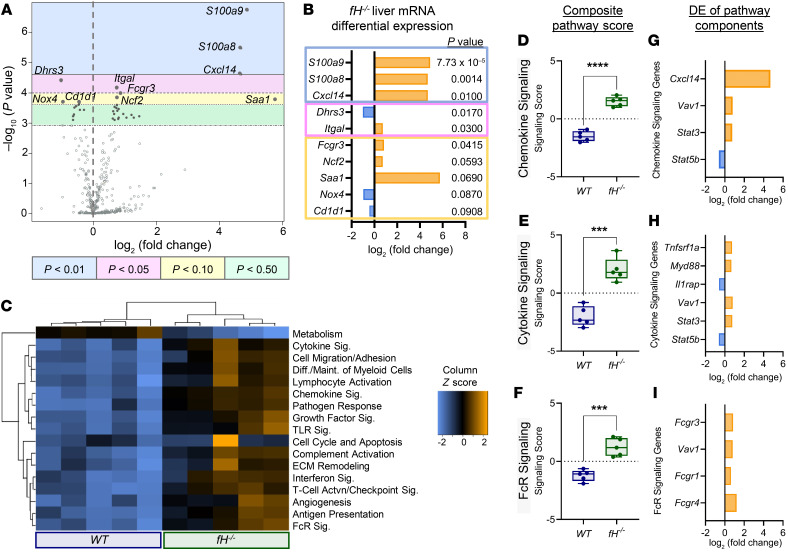
Figure 4. Analysis of liver mRNA reveals upregulation of multiple inflammatory signaling pathways in fH–/– mice.
(A) Volcano plot of fH–/– liver mRNA DE compared with WT covariate and (B) the fold change of the 10 most DE mRNA. Bonferroni’s P values are shown below. (C) Heatmap of myeloid innate immune pathways (data are displayed on the same scale due to Z-transformation; increasing, neutral, or reduced expression indicated by orange, black, or blue, respectively). (D–I) DE of mRNA in fH–/– livers compared with WT livers. Box-and-whisker plots (D–F) showing the composite pathway scores for 3 of the most differentially expressed pathways. ****P < 0.0001, t = 11.01, df = 7.954 (D); ***P = 0.0002, t = 6.777, df = 7.816 (E); ***P = 0.0006, t = 6.033, df = 6.752 (F); unpaired, 2-tailed t test with Welch’s correction. For box-and-whisker plots: box = 25th–75th percentile, line = median, and whiskers = maximum and minimum values. (G–I) The most DE genes (Bonferroni-adjusted P ≤ 0.25) within each of the 3 corresponding composite pathways (D–F). For all experiments, n = 5 males (3 months old) per group. DE, differential expression; Sig, signaling.

