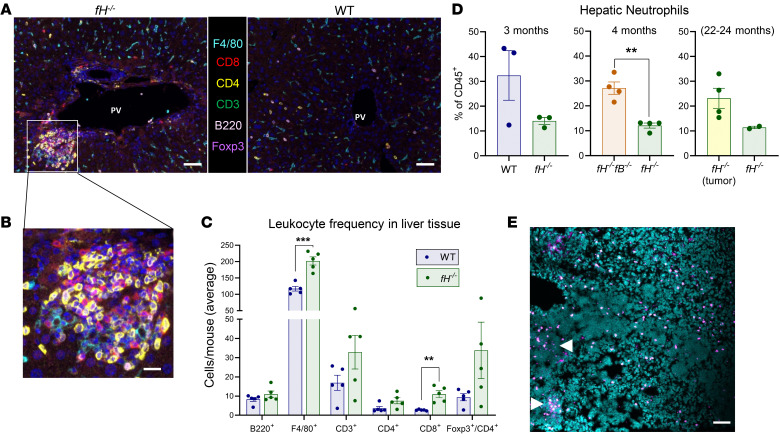
Figure 5. Inflammation and leukocyte infiltration in fH–/– livers.
(A and B) Large pockets of inflammatory infiltrate captured by multiplex imaging in fH–/– (A, left, and B) but not in WT livers (A, right). Nuclei stained with DAPI (blue). Original magnification ×200. Scale bars: 50 μm (A), 10 μm (B). (C) Increased populations of each cell type in fH–/– livers compared with WT. F4/80+, ***P = 0.0002, t = 6.802, df = 7.559; CD8+, **P = 0.0069, t = 4.949, df = 4.178; CD4+, P = 0.1228; CD3+, P = 0.1868; Foxp3+/CD4+, P = 0.1409; B220+, P = 0.2894. For A–C, n = 5 males (3 months) per group; 2-tailed t test with Welch’s correction; mean ± SEM. (D) By flow cytometry, young fH–/– males have fewer hepatic neutrophils compared with WT (P = 0.2067) and fH–/–fB–/– (**P = 0.0051, t = 5.596, df = 3.963) mice. Neutrophils trend higher in fH–/– males with liver tumors compared with those without (P = 0.061). Data were analyzed by unpaired, 2-tailed t test with Welch’s correction; mean ± SEM; n = 3 per group (fH–/– and WT, 3 months); n = 4 per group (fH–/– and fH–/–fB–/–, 4 months); n = 4 and 2 (fH–/– with and without liver tumors, respectively; 22–24 months). (E) Clusters of Ly6G+ cells (pink) are observed in livers with multiple tumor foci (arrows). Scale bars: 50 μm; n = 10 independent fH–/– liver tumors. Nuclei stained with DAPI (turquoise). All images are representative of 2 independent experiments.

