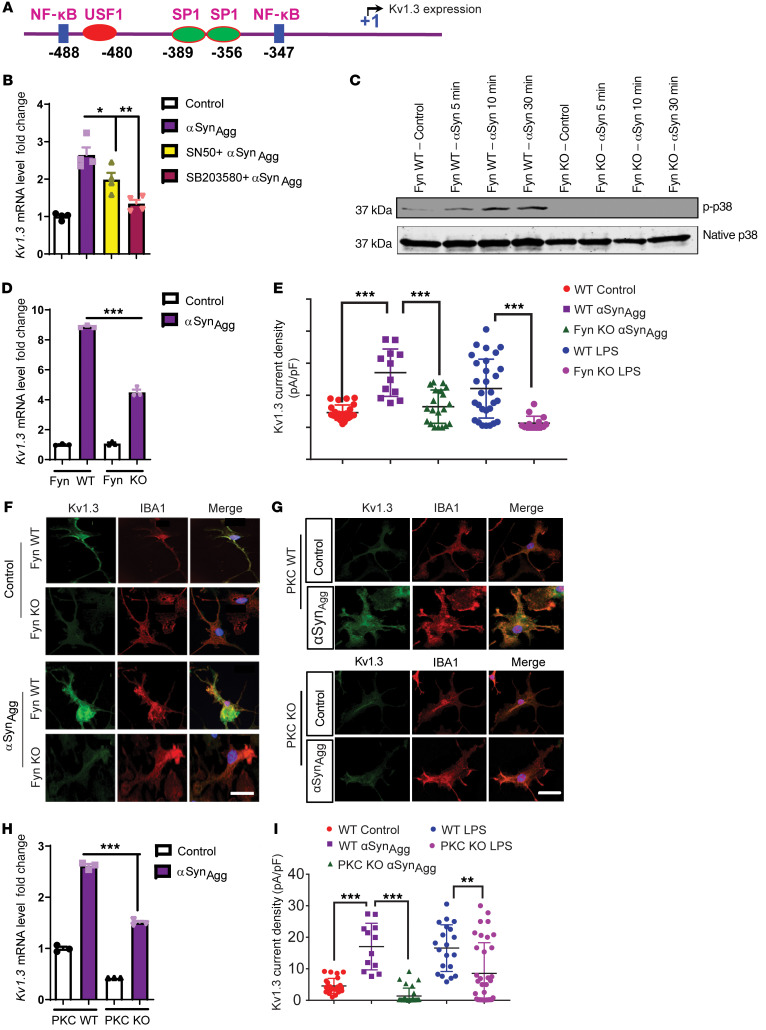
Figure 4. Fyn modulates the transcriptional regulation of Kv1.3 in microglial cells through the Fyn/PKCδ kinase signaling cascade.
(A) In silico analysis of the promoter sequence of Kv1.3 revealed probable Nf-κB– and SP1-binding sites. (B) qRT-PCR analysis of immortalized MMCs cotreated with αSynAgg and either SN50 (100 μg/mL) or SB203580 (1 μM), showing that both compounds attenuated αSynAgg-induced Kv1.3 expression. (C) Western blot of Fyn WT and KO PMCs treated with αSynAgg, showing that Fyn KO reduced the induction of the p38 MAPK pathway. (D) qRT-PCR analysis revealed that Fyn KO reduced αSynAgg-induced Kv1.3 mRNA levels. (E) Whole-cell patch-clamp recording showing that Fyn KO attenuated αSynAgg- and LPS-induced Kv1.3 activity compared with Fyn WT PMCs (WT control n = 24, WT αSynAgg n = 12, WT LPS n = 29, Fyn KO αSynAgg n = 20, Fyn KO LPS n = 15). (F) ICC showing that Fyn KO reduced αSynAgg-induced Kv1.3 protein levels in PMCs. Scale bar: 15 μm. (G) ICC of PMCs revealed that αSynAgg-induced Kv1.3 protein expression was reduced by PKCδ KO. Scale bar: 15 μm. (H) qRT-PCR analysis of PMCs showing that PKC KO reduced the expression of αSynAgg-induced Kv1.3 mRNA. (I) Whole-cell patch clam recording of PMCs showing that PKC KO attenuated αSynAgg- and LPS-induced Kv1.3 activity compared with PKC WT PMCs (WT control n = 24, WT αSynAgg n = 12, WT LPS n = 20, PKC-KO αSynAgg n = 29, PKC-KO LPS n = 35). Data are presented as the mean ± SD. A 1-way ANOVA was used to compare multiple groups. In most cases, Tukey’s post hoc analysis was applied. Each dot on the bar graphs represents a biological replicate. Data are presented as the mean ± SEM, with 3–4 biological replicates from 2–3 independent experiments unless otherwise indicated. *P ≤ 0.05, **P < 0.01, and ***P < 0.001.

