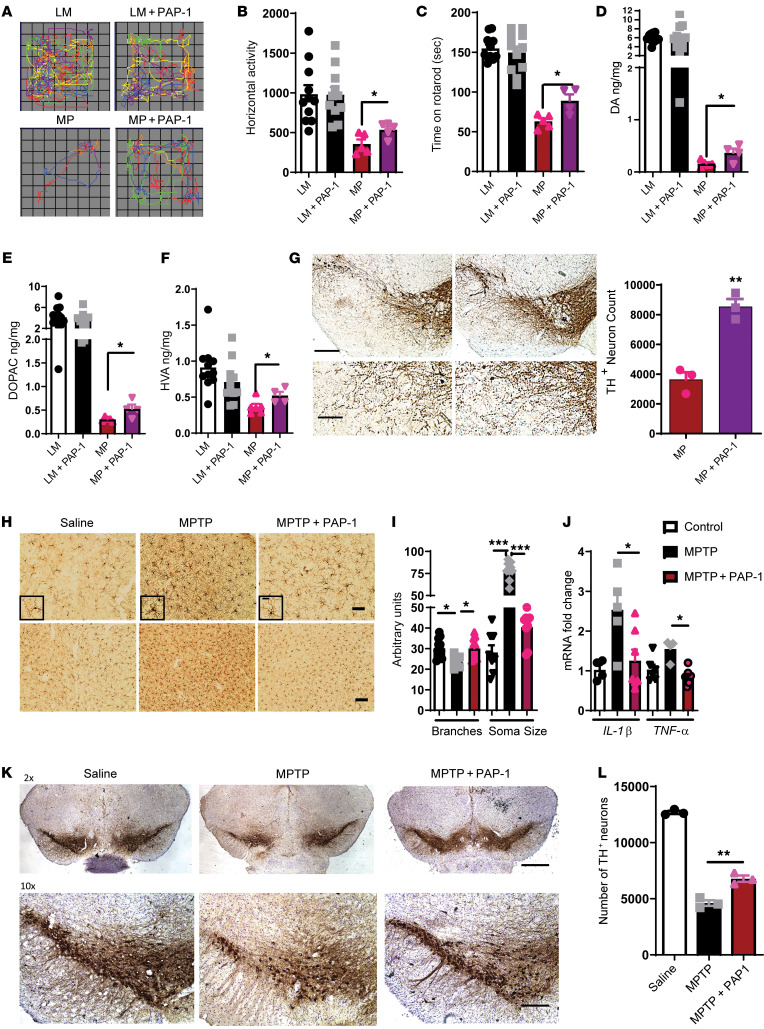
Figure 7. PAP-1 reduces inflammation and neurodegeneration in mouse models of PD.
(A–H) MitoPark mouse model. (A) Representative movement tracks showing that PAP-1 rescued movement deficits of MitoPark mice at 20 weeks. (B) VersaMax open-field test showed increased horizontal activity of MitoPark mice treated with PAP-1 compared with the vehicle-treated control group. (C) Behavior test revealed increased time spent on the rotarod by MitoPark mice treated with PAP-1 compared with the vehicle-treated group. (D–F) HPLC showing that PAP-1 treatment protected MitoPark mice from loss of (D) dopamine (DA), (E) DOPAC, and (F) HVA. (G) IHC of SNpc showing that PAP-1 protected against loss of TH-positive neurons in MitoPark mice and stereology analysis of the SNpc showing that PAP-1 decreased the loss of TH-positive neurons in MitoPark mice. Scale bars: 200 μm (top panel); 100 μm (bottom panel). (H–L) MPTP mouse model. (H) IHC of MPTP-exposed substantia nigra and striatum showing that PAP-1 altered microgliosis. Scale bars: 50 μm (top panel); 20 μm (insets); 100 μm (bottom panel). (I) ImageJ analysis of MPTP-exposed substantia nigra showing that PAP-1 reduced soma size and increased the number of microglial branches. (J) qRT-PCR analysis of striatum after MPTP showing reduced mRNA expression of proinflammatory factors IL-1β and TNF-α. (K) IHC of SNpc showing that PAP-1 protected against MPTP-induced loss of TH-positive neurons. Scale bars: 500 μm (top panel); 200 μm (bottom panel). (L) Stereological analysis of the SNpc showing that PAP-1 decreased the loss of TH-positive neurons after MPTP treatment. One-way ANOVA was used to compare multiple groups. In most cases, Tukey’s post hoc analysis was applied. Each dot on the bar graphs represents a biological replicate. Data are presented as the mean ± SEM, with 3–7 animals per group. *P ≤ 0.05, **P < 0.01, and ***P < 0.001.

