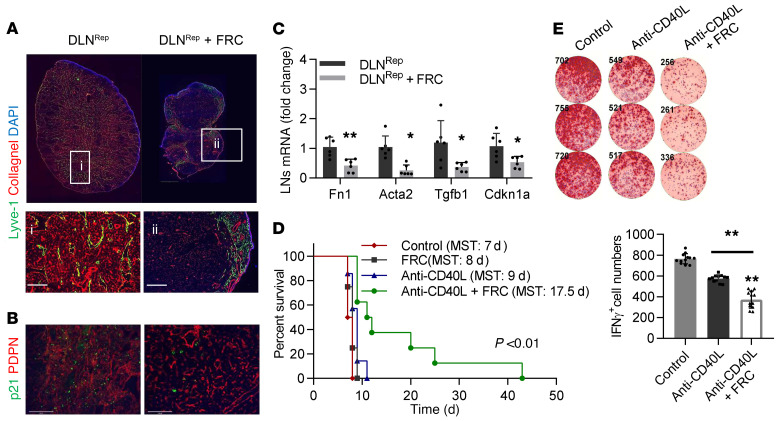
Figure 5. Injection of healthy FRCs decreases ECM accumulation induced by transplantation.
(A) IF staining of collagen I fibers (red) in DLNRep and DLNRep plus FRC mice. Scale bars: 1000 μm and 50 μm (enlarged insets). (B) Costaining of the senescence indicator p21 (green) with PDPN (red) in the DLNRep and DLNRep plus FRC treatment groups. Scale bars: 50 μm. (C) Gene expression levels of Fn1, Acta-2, Tgfb1, and Cdkn1a in the DLNRep of untreated mice and those treated with healthy FRCs (n = 6). (D) Kaplan-Meier survival curve for untreated mice (control: red, n = 4) and mice treated with FRCs (5 × 10⁴/mouse, black, n = 4), anti-CD40L (9 μg/mouse, blue, n = 7), and anti-CD40L (9 μg/mouse) plus FRCs (5 × 10⁴/mouse) (green, n = 8) following allogeneic heart transplantation. MST, mean survival time.**P < 0.01, by log-rank (Mantel-Cox) test. (E) ELISpot assay shows the number of IFN-γ+ splenocytes in the untreated group, the anti-CD40L treatment group, and the anti-CD40L plus FRC treatment group on day 7 after heart transplantation (n = 4). The percentage of areas stained positive in the fluorescence micrographs was assessed in 3–6 random microscopic fields for each mouse. Data are presented as the mean ± SD. *P < 0.05 and **P < 0.01, by 2-tailed Student’s t test (A–C) and 2-way ANOVA with Tukey’s multiple comparisons post hoc test (E).

