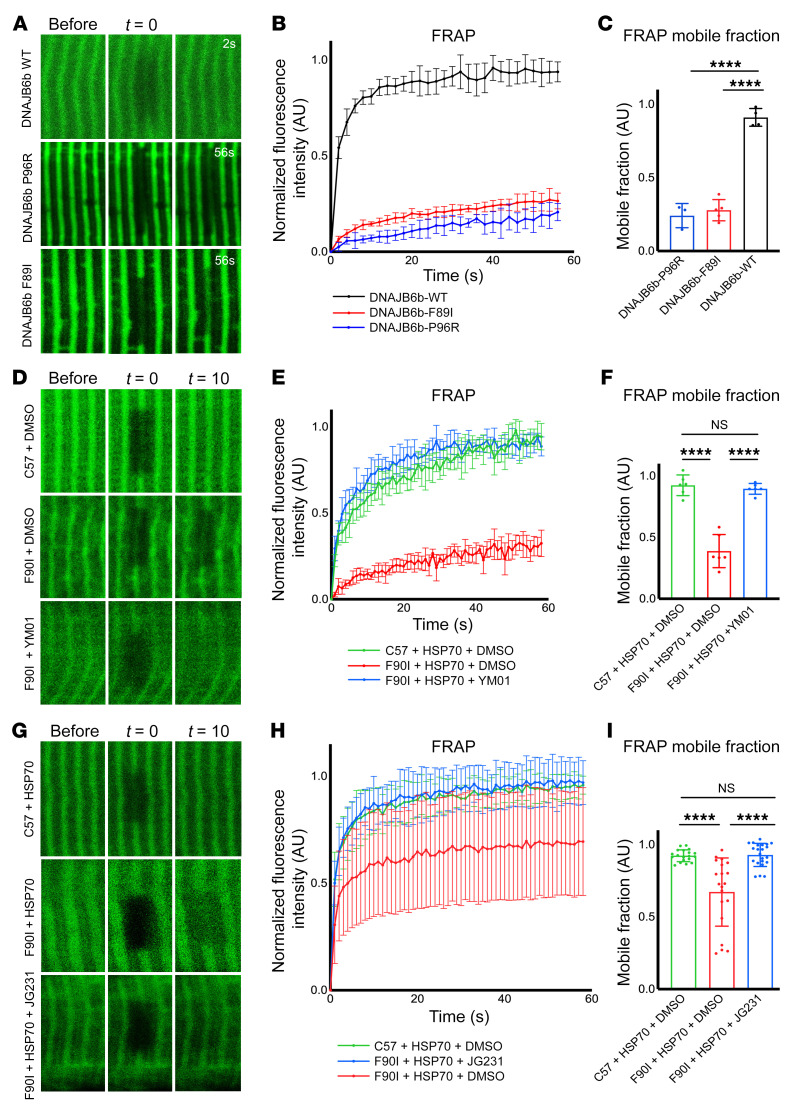
Figure 6. Imaging of DNAJB6 and HSP70 kinetics at the Z-disc.
(A) Fluorescence recovery after photobleaching was performed with 2PEM footpads of mice following electroporation into the FDB with constructs expressing GFP-DNAJB6b-WT, -P96R, or -F89I. Representative images show before bleaching, after bleaching (t = 0 seconds), and after t = 2 seconds or t = 56 seconds. (B) Graph of the normalized relative fluorescence intensity (RFI) versus the time in seconds for the studies in A. (C) Graph of the percentage of maximum fluorescence recovery corresponding to the mobile versus immobile fraction. n = 3–5 separate myofibers from 1 mouse per condition. (D–I) Experiments similar to those in A following electroporation of HSP70-GFP in C57 control or DNAJB6-F90I heterozygous mice. The footpads of mice were injected with YM01 (D–F), or mice were injected i.p. with JG231 (G–I). (D and G) Representative images show before bleaching, after bleaching (t = 0 seconds), and after t = 10 seconds. (E and H) Graph of the normalized RFI versus the time in seconds for the studies in D and G, respectively. (F and I) Graph of the percentage of maximum fluorescence recovery corresponding to the mobile versus immobile fraction for the studies in D and G, respectively. All individual data points represent the mean of 3 separate FRAP experiments within 1 myofiber. FRAP curves (B, E, and H) and mobile fraction bar graphs (C, F, and I) represent the mean of all myofiber averages ± SD. For YM01 experiments in D–F, n = 6 myofibers from 2 mice per condition. For JG231 experiments in G–I, n = 19–22 myofibers from 3 mice per condition. ****P < 0.0001, by 1-way ANOVA followed by Tukey’s post hoc test for group comparisons. The high variability in the FRAP mobile fraction for the DNAJB6-F90I mice electroporated with HSP70-GFP and treated with i.p. DMSO was largely driven by 4 data points (H and I). These 4 data points were derived from different myofibers within 1 animal. Reanalysis of the data after removing this mouse showed that the results remained statistically significant (***P = 0.0002).

