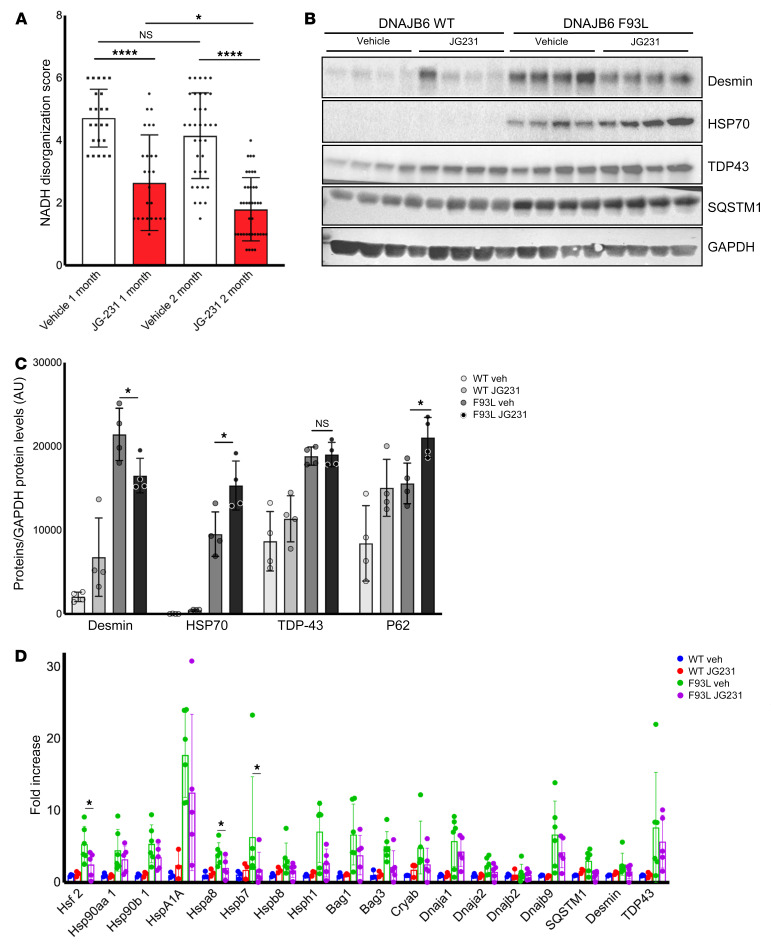
Figure 9. JG231 induces a partial recovery of protein quality control in LGMDD1 mice.
(A) Graph of average NADH disorganization, scored from TA muscle from 4-month-old DNAJB6b-F93L mice treated with vehicle or JG231 for 4 weeks (n = 6 mice per cohort with 3–4 images per mouse) or 8 weeks (n = 4 per cohort with 9–10 images per mouse). Error bars indicate the SD. *P < 0.05 and ****P < 0.0001, by 1-way ANOVA followed by Tukey’s post hoc test for comparisons between groups. (B and C) Immunoblot and quantification of TA muscle lysates from 4 different DNAJB6b-WT and DNAJB6b-F93L mice treated with vehicle (Veh) or JG231 for 8 weeks using antibodies against desmin, HSP70, TDP43, SQSTM1, and GAPDH. *P ≤ 0.001, by 2-way ANOVA with Bonferroni’s correction for multiple comparisons. (D) qPCR analysis of TA muscle from 4-month-old DNAJB6b-WT and DNAJB6b-F93L mice treated with vehicle or JG231 for 4 weeks. Data are presented as the fold change compared with C57 controls. *P < 0.05, by paired Student’s t test for comparisons between groups; Bonferroni-adjusted P < 0.0028 for multiple comparisons.

