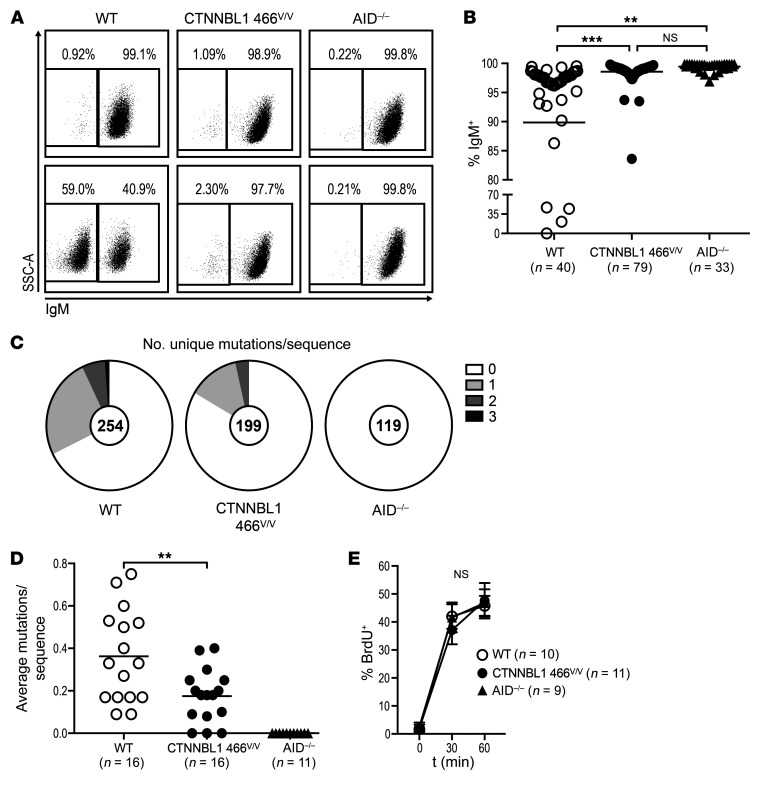
Figure 5. The CTNNBL1 466V mutation impairs SHM in Ramos B cells.
(A) Representative flow cytometric plots of surface IgM expression on single-cell-derived colonies of WT, CTNNBL1 466V/V, and AID–/– Ramos B cells 12 weeks after seeding. (B) Summary of IgM+ cell frequencies in single-cell-derived Ramos colonies. Bars represent the mean. **P ≤ 0.01; ***P ≤ 0.001 by 1-way ANOVA followed by Tukey’s post hoc test. (C) Pie charts represent the number of newly acquired mutations per VH4-34 sequence after single-cell seeding. Number of analyzed sequences indicated in the center of the chart. (D) Summary of newly acquired mutations per sequence originating from a single cell. Each data point represents the average mutations per sequence of 1 single-cell-derived culture; bars indicate the mean. **P ≤ 0.01 comparing CTNNBL1 genotypes, obtained by 2-tailed, unpaired t test. (E) Proliferation rate of randomly selected single-cell-derived colonies measured by BrdU incorporation at indicated time points. Represented are means and SD. Significance was tested by 2-way ANOVA followed by Tukey’s post hoc test. NS, not significant.

