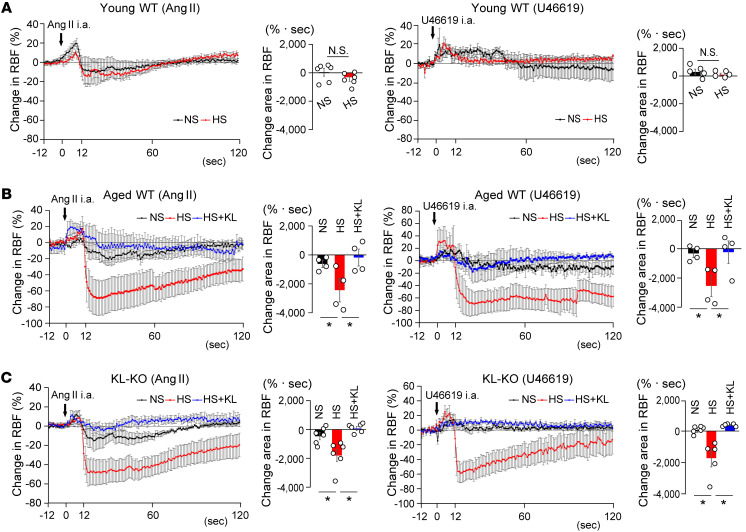
Figure 8. Klotho supplement normalizes augmented response of RBF to Ang II and U46119 in salt-loaded aged WT mice and heterozygous KL-KO mice.
(A) Percent changes in RBF with the intra-arterial injection of Ang II (left) or U46619 (right) in young WT mice with NS or HS diet. Bar graphs show the area under the curve of changes in RBF compared with the baseline. For Ang II, n = 6 each; for U46619, n = 5 each. N.S., not significant. (B) Percent changes in RBF upon intra-arterial injection of Ang II (left) or U46619 (right) in aged WT mice receiving NS, HS, or HS diet + Klotho supplementation. Bar graphs show the area under the curve of changes in RBF relative to the baseline. n = 4 each. *P < 0.05 vs. HS diet–fed mice. (C) Percent changes in RBF upon intra-arterial injection of Ang II (left) or U46619 (right) in KL-KO mice with NS diet, HS diet, or HS diet + KL. Bar graphs show area under the curve of changes in RBF relative to the baseline. Ang II, n = 6 each; U46619, n = 6 (NS diet), n = 5 (HS diet), and n = 5 (HS diet + KL). *P < 0.05 vs. HS diet–fed mice. Data are means ± SEM. Unpaired t tests were performed on comparisons between 2 groups. For multiple comparisons, statistical analysis was performed by Tukey-Kramer post hoc test.

