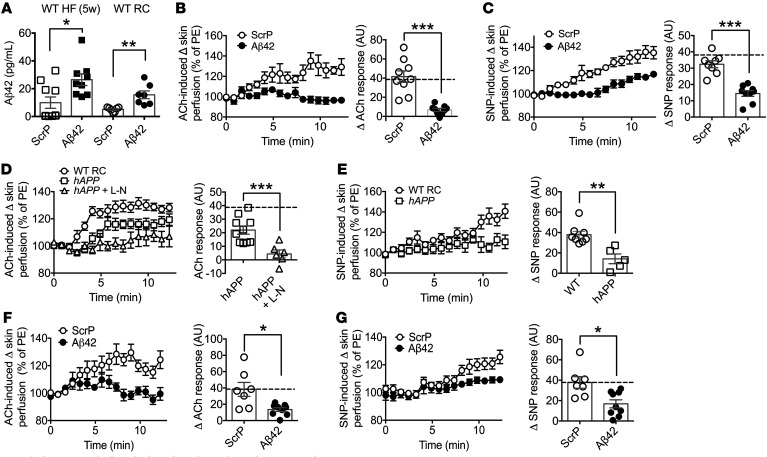
Figure 3. Increased circulating Aβ42 impairs microvascular function.
(A) Plasma Aβ42 levels in HF-fed (5 weeks) and RC-fed WT mice after 4 weeks of Aβ42 or ScrP infusion (n = 7–10). (B) Endothelium-dependent microvascular responses induced by ACh in ScrP- and Aβ42-treated HF-fed (5 weeks) WT mice (n = 9). Quantitative analysis of ACh responses for ScrP- and Aβ42-treated mice. The broken line denotes the RC-fed WT ACh response. PE, phenylephrine. (C) Endothelium-independent responses induced by SNP in ScrP- and Aβ42-treated HF-fed (5 weeks) WT mice (n = 8–9). Quantitative analysis of SNP responses for ScrP- and Aβ42-treated mice. The broken line denotes the RC-fed WT SNP response. (D) Microvascular responses induced by ACh in RC-fed WT and hAPPSw mice and hAPPSw mice with L-NAME (L-N) (n = 6–16). Quantitative analysis of ACh responses for hAPPSw mice in the absence and presence of L-NAME. The broken line denotes the RC-fed WT ACh response. (E) Endothelium-independent responses induced by SNP in RC-fed WT and hAPPSw mice (n = 5–8). Quantitative analysis of SNP responses. (F) Endothelium-dependent microvascular responses induced by ACh in ScrP- and Aβ42-treated RC-fed WT mice (n = 7–9). Quantitative analysis of ACh responses for ScrP- and Aβ42-treated mice. The broken line denotes the RC-fed WT ACh response. (G) Endothelium-independent responses induced by SNP in ScrP- and Aβ42-treated RC-fed WT mice (n = 7–9). Quantitative analysis of SNP responses for ScrP- and Aβ42-treated mice. The broken line denotes the RC-fed WT SNP response. Data are means ± SEM. *P < 0.05; **P < 0.01; ***P < 0.001 by 2-tailed unpaired Student’s t test.

