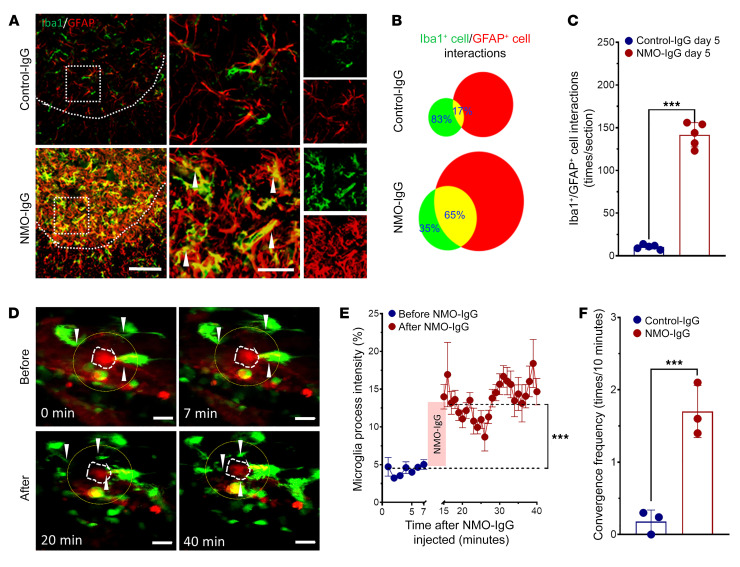
Figure 7. NMO-IgG induces astrocyte-microglia interaction.
(A) Interaction between Iba1+ microglia (green) and GFAP+ astrocytes (red) is inferred from enlargement and overlapping (shown by arrow heads) of those cells and their processes in dual immunostained L4 spinal cord of NMO-IgG–recipient mice compared with control-IgG recipients. n = 5 mice (4 sections/mouse). Scale bars: 200 μm (left) and 20 μm (right). (B) Venn diagram and (C) bar graph quantifies (by ImageJ software) the increase in overlap from 17% (control-IgG recipients) to 65% (NMO-IgG recipients). n = 5 mice (4 sections/mouse). (D) Representative 2-photon images captured in vivo show, at baseline time (top, before NMO-IgG infusion), few processes extending from microglia (green, Cx3cr1gfp/+; astrocytes are labeled red by SR101). After NMO-IgG infusion (bottom), microglial processes converged toward an astrocyte. Arrowheads indicate the converging microglial processes. n = 3 mice. Scale bars: 20 μm. (E) Graph shows quantified Cx3cr1gfp/+ intensity of microglial processes in the area surrounding the SR101-labeled astrocyte (yellow circles in D). n = 3 mice. (F) Bar graph shows the microglial convergence event frequency (convergence events per 10 minutes) after NMO-IgG or control-IgG infusion (for 30 minutes). n = 3 mice. Data presented as the mean ± SEM. ***P < 0.001 by 2-tailed Student’s t test (C, E, and F).

