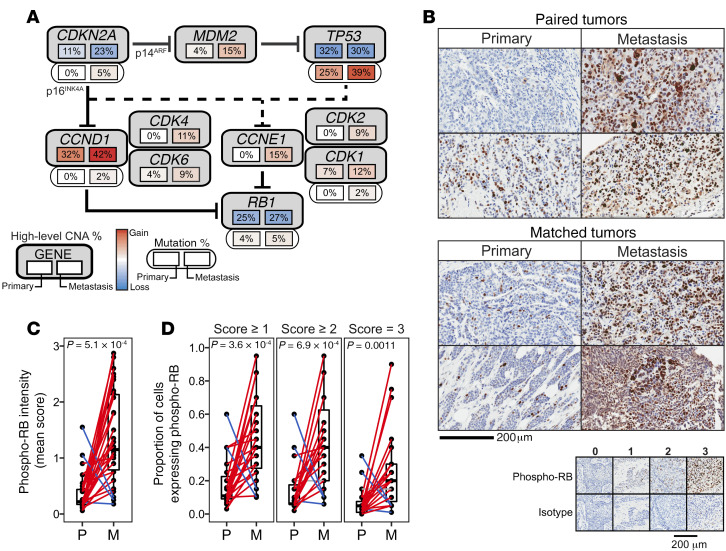
Figure 6. pRB is preferentially inactivated in metastases.
(A) Pathway schematic of genes downstream of p16INK4A/p14ARF and/or upstream of pRB. Solid and dashed lines indicate direct and indirect relationships between gene products. The frequencies of high-level CNAs (upper) and mutations (lower, where provided) in each gene are shown for primary tumors (left) and metastases (right) beneath each gene. (B) Representative phospho-RB IHC images for paired (n = 8) and matched primary and metastatic tumors (n = 15). (C) Mean phospho-RB staining intensity and (D) proportion of cells that are phospho-RB+ in paired and matched primary and metastatic tumors (1-sided Wilcoxon’s signed-rank test).

