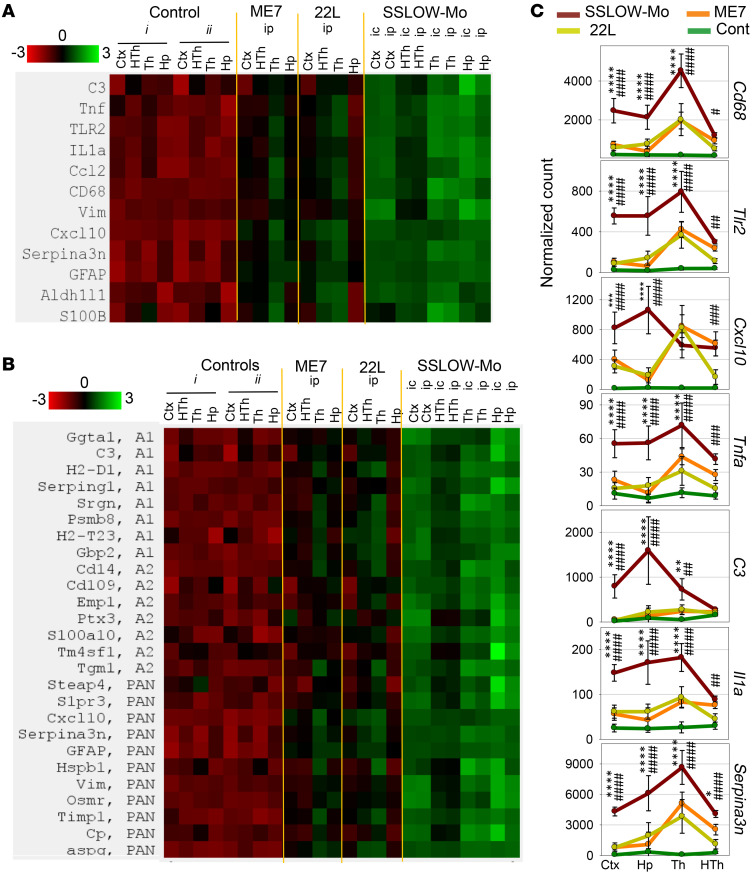
Figure 8. Analysis of region-specific neuroinflammation in passage 6 of SSLOW-Mo.
Grouped-samples heatmap analysis of the expression of proinflammatory genes, genes reporting on neuroinflammation, and astrocyte-specific genes (A), or A1-, A2-, and PAN-specific markers (B) in 4 brain regions (Ctx, cortex; HTh, hypothalamus; Th, thalamus; Hp, hippocampus) of ME7 or 22L animals infected via the i.p. route (n = 6), passage 6 of SSLOW-Mo animals infected via the i.p. (n = 6) or i.c. route (n = 3), and the following normal control groups: group i (n = 3) is for SSLOW-Mo and 22L animals, and group ii (n = 6) is for ME7. (C) Normalized expression of Cd68, Tlr2, Cxcl10, Tnfa, C3, Il1a, and Serpina3n genes in 4 brain regions (Ctx, cortex; Hp, hippocampus; Th, thalamus; HTh, hypothalamus) in ME7 (orange lines), 22L (yellow lines), passage 6 of SSLOW-Mo (red lines) animals infected via the i.p. route, or normal control animals (green lines, groups i and ii combined data). Data presented as the mean ± SD. * and # indicate significant differences between SSLOW-Mo and 22L, or SSLOW-Mo and ME7, respectively (**** or ####P < 0.0001; *** or ###P < 0.001; ** or ##P < 0.01; * or #P < 0.05; n = 6 for SSLOW-Mo, 22L and ME7 groups, n = 6 for SSLOW-Mo, 22L and ME7 groups, n = 9 for the control group). P values were calculated using ordinary 2-way ANOVA with Tukey’s multiple-comparisons test.

