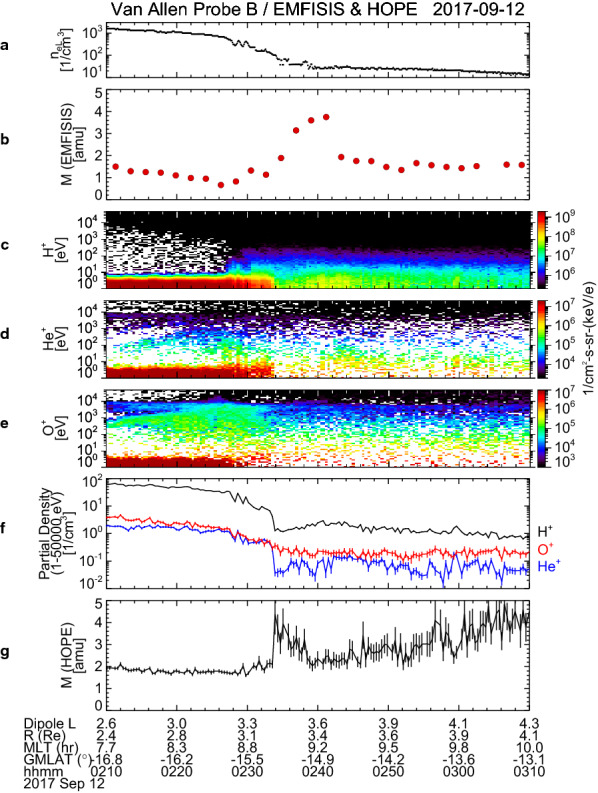
Fig. 9.

Van Allen Probe B/EMFISIS observations of a electron density at the satellite position and b average plasma mass for 02:10–03:10 UT on 12 September 2017, which are the identical to Fig. 6a and b. Van Allen Probe B/HOPE observations of c–e the energy-time diagrams of H+, He+, and O+ ions, f partial densities of H+ (black), He+ (blue), and O+ (red) ions calculated from ion fluxes over the energy range of 1 eV–50 keV, and g average plasma mass calculate from the partial densities, for 02:10–03:10 UT
