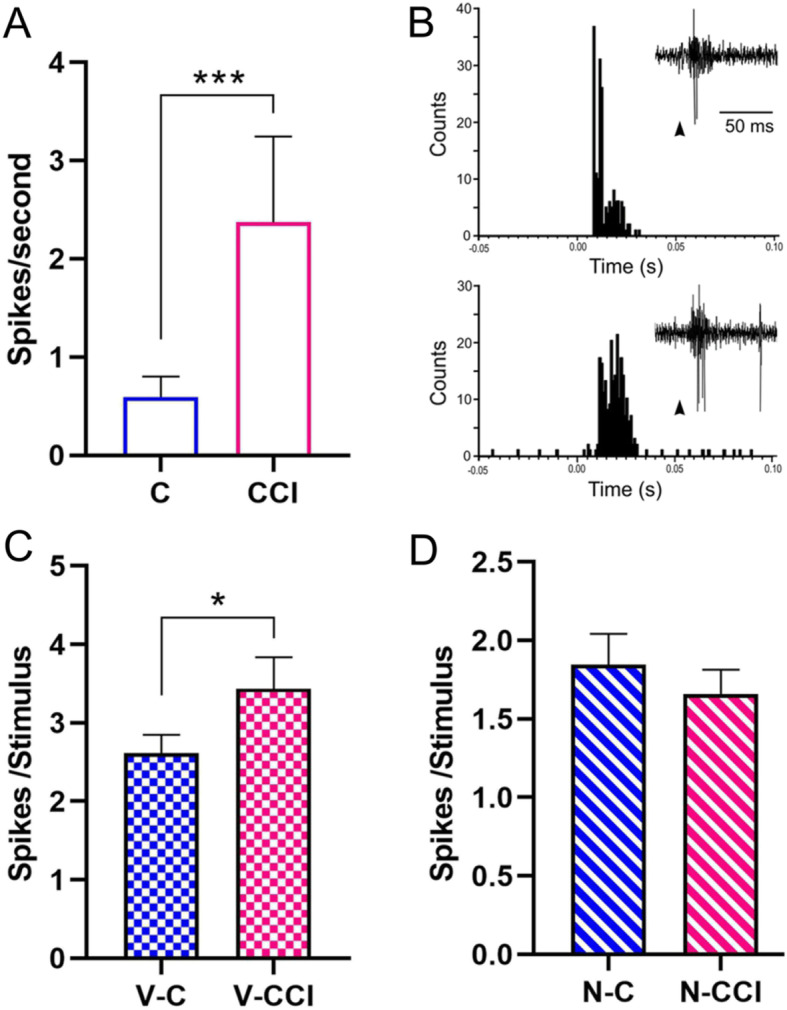
Fig. 3.

Changes in spontaneous and input-evoked activity of TCC neurons after CCI-IoN. (a) Frequency of spontaneous discharges increased four-fold in CCI-IoN animals (C, control group; CCI, CCI-IoN group). (b) Representative PSTHs of vibrissal responses (50 stimuli) in a control case (upper plot) and in a CCI-IoN rat (lower plot). Insets show raw data examples; arrowheads indicate stimulus onset. The response was higher in the CCI-IoN rat. (c) Plot of the mean vibrissal response in control and in CCI-IoN animals. The response was greater in CCI-IoN animals. (d) The response to GON stimulation did not differ significantly between control and CCI-IoN animals. V-C, vibrissal response in control animals; V-CCI, vibrissal response in CCI-IoN animals; N-C, GON response in control animals; N-CCI, GON response in CCI-IoN animals; * p < 0.05; *** p < 0.0001
