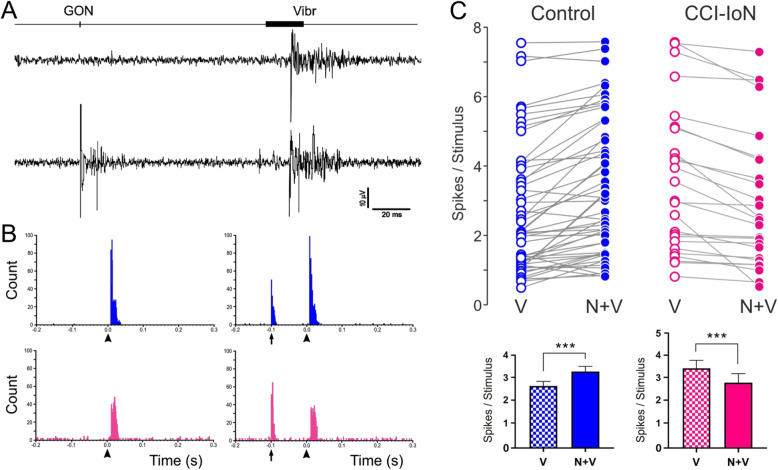
Fig. 4.
Effect of GON stimulation on vibrissal responses in control (blue) and CCI-IoN (magenta) animals. (a) An example of raw recordings during vibrissal stimulation alone (upper trace) or preceded by GON stimulation (lower trace). (b) Representative PSTHs in a control case (upper plot) and a CCI-IoN case (lower plot). Plots on the left show the response to vibrissal stimulation (arrowheads) alone. On the right, responses to vibrissal stimulation (arrowheads) when preceded by GON stimulation (vertical arrow) are illustrated. In the control case (top) GON stimulation facilitated vibrissal response, whereas the opposite occurred in the CCI-IoN. (c) Top, same-case comparisons between vibrissal responses alone (V, empty circles) and when preceded by GON stimulation (N + V, 100 ms delay; filled circles) in control (blue traces) and CCI-IoN animals (red traces). Bottom, mean (+sem) vibrissal responses from the data above. GON stimulation facilitated vibrissal response in control animals but inhibited vibrissal responses in CCI-IoN animals. *** p < 0.0001

