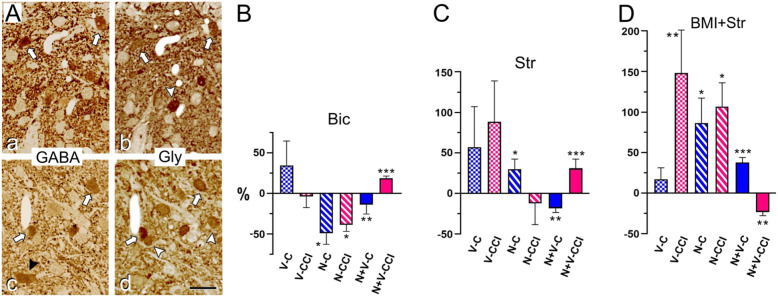
Fig. 6.
(A) Examples of two pairs of GABA- (a, c) and Glycine-immunoreacted (b, d) consecutive semithin sections from laminae I-II (a, b) and III (c,d) at rostral levels of the TCC in a control rat. In agreement with previous findings (Avendaño et al., 2005), over one-third of neuron profiles display immunoreactivity for either GABA or Glycine. The majority shows various degrees of coexpression (some are indicated by white arrows), followed by those expressing only Glycine (white arrowheads). A small number of cells are only GABA-immunolabeled (black arrowhead in c). Scale bar = 20 μm. (B-D) Effect of antagonists of GABA- and Glycinergic neurotransmission on TCC neuronal responses. (B) In presence of the GABAA receptor antagonist bicuculline (Bic; 20 mM), GON responses were reduced both in controls and CCI-IoN cases, whereas vibrissal responses were essentially unaltered. (C) By contrast, the Glycinergic receptor antagonist strychnine (Str; 100 μM) increased, albeit non-significantly, the vibrissal responses in both groups, and significantly increased GON responses in controls. (D) When both antagonists were applied simultaneously (i.e. the ‘cocktail’ application; Bic, 20 mM + Str, 100 μM) there was a general increase of responses to vibrissae and GON stimulation, which only failed to reach significance for vibrissal responses in controls. The interaction of GON and vibrissal stimulation was affected in all cases by Bic, Str, or the ‘cocktail’ application, in the same directions if any of the drugs had been applied separately (reduced response to vibrissae in controls, and enhanced in CCI-IoN cases), and in opposite directions when both drugs were applied simultaneously. Abbreviations as in Figs. 3 and 4. All values are expressed as a percentage of change with respect to the corresponding basal responses before each drug application. *, p < 0.05; **, p < 0.01; ***, p < 0.001

