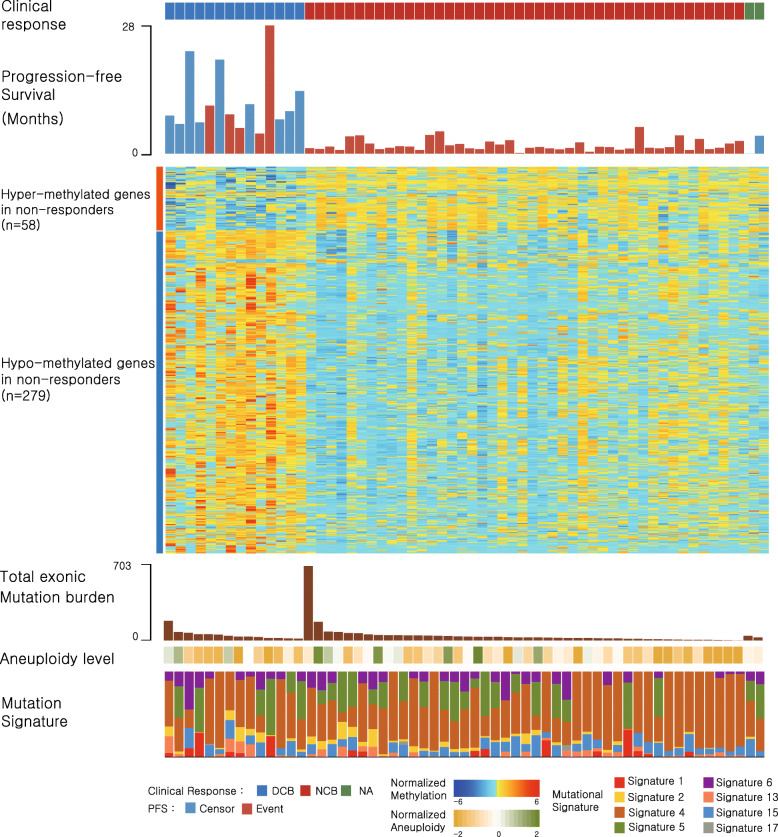
Fig. 1.
Genomic characteristics of nonresponders and responders. The patients are ordered according to their clinical classification: durable clinical benefit (DCB; responders) on the left, non-durable benefit (NDB; nonresponders) on the middle, and unknown on the right. Within the groups, samples are ordered by decreasing mutation burden. Heatmap (normalized by z score transformation per row) shows differentially methylated promoter genes between responders and nonresponders (P < 5 × 10⁻⁵ by t test). The total exonic mutation burden, aneuploidy level, and mutation signature obtained from whole-exome sequencing data are shown below the heatmap

