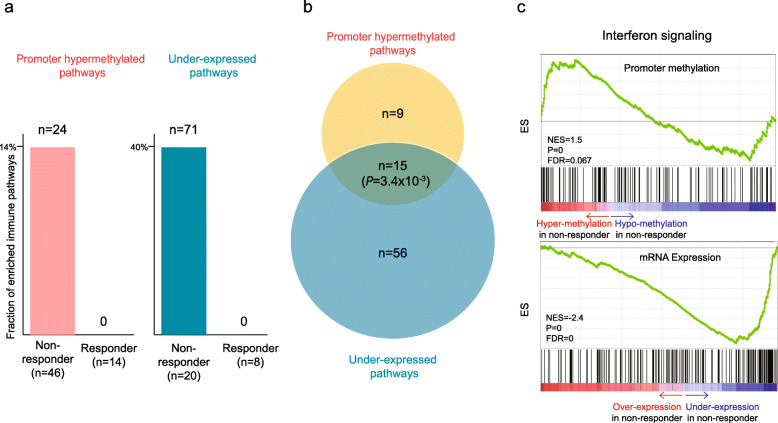
Fig. 2.
Transcriptional silencing of immune pathways by promoter hypermethylation in nonresponders. a Fraction of enriched hypermethylated (left) and under-expressed immune pathways (right) in nonresponders and responders. The number of the pathways showing significant enrichment (FDR < 0.1) by GSEA is indicated above the bars. b Relationship between enriched hypermethylated and under-expressed immune pathways in nonresponders. The significance of overlap was determined by Fisher’s exact test. c Representative GSEA plots of the overlapped pathways

