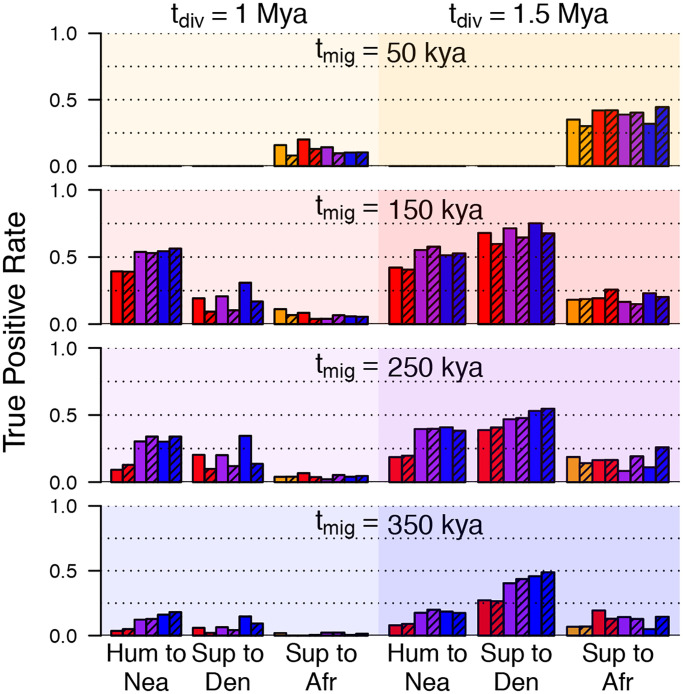
Fig 5. Simulation results.
Each panel represents a set of simulations generated with a different value of tmig (rows) and tdiv (columns). Within each panel, each bar gives the basewise true positive rate for a particular migration event, using a posterior probability threshold of 0.5. The color of each bar represents the value of tmig assumed for the inference model (orange = 50kya, red = 150kya, purple = 250kya, blue = 350kya). Shaded bars represent an assumption of tdiv = 1.5Mya for inference, whereas solid bars represent tdiv = 1.0Mya. Because the archaic hominin fossils are older than 50kya, results for tmig = 50kya (top) are only applicable for introgression into humans.

