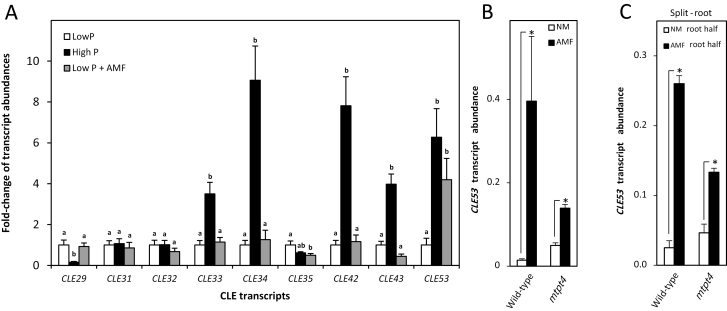
Fig. 3.
CLE transcript abundances measured by RT–qPCR. (A) Transcript abundance of M. truncatula CLE genes from the identified clade, except for MtCLE12 and MtCLE13, in roots of plants grown at low P (6 μM Pi), high P (600 μM Pi), and low P inoculated with arbuscular mycorrhizal fungi (AMF) (6 μM Pi). For each transcript, low P expression levels were normalized to 1. Bars are average values ±SD (n=5). Different letters indicate significant differences between individual CLE transcript abundances based on one-way ANOVA followed by Tukey´s post-hoc test (P<0.05). (B) Transcriptional response of MtCLE53 to AMF colonization in the wild type and mtpt4. (C) Transcriptional responses in the wild type and mtpt4 of MtCLE53 in the AMF-colonized root half (AMF) compared with the non-colonized root half (NM) in a split-root system. Bars are averages ± SD (n=3). Significant differences in (B) and (C) are marked with asterisks (*) and were calculated based on two-sided Student’s t-test (P<0.05).

