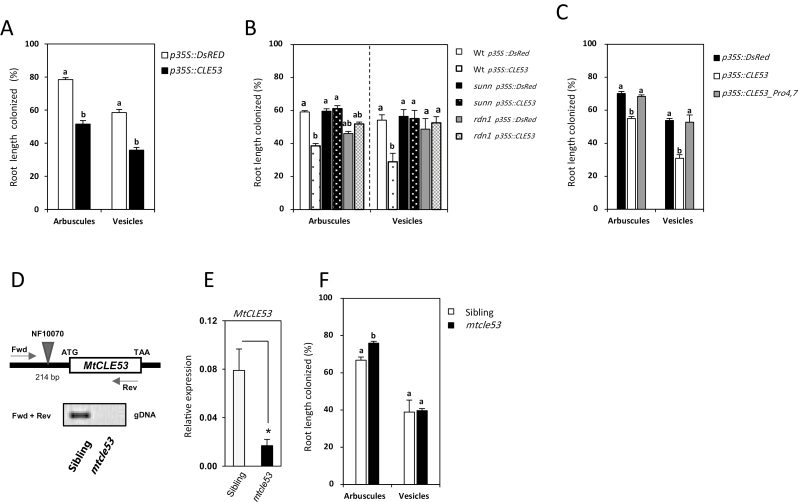
Fig. 4.
Root length colonization by mycorrhizal arbuscules and vesicles in different genetic backgrounds. (A) Composite plants overexpressing p35S::CLE53 compared with empty vector controls (p35S::DsRed) in the wild-type background. (B) Composite plants overexpressing p35S::CLE53 compared with empty vector controls (p35S::DsRed) in the wild-type, sunn, and rdn1 backgrounds. (C) Composite wild-type plants overexpressing a native version of MtCLE53 (p35S::CLE53) and a mutated version with prolines changed to glycines (p35S::CLE53_Pro4,7) compared with the empty vector control (p35S::DsRed). Root length colonization was assessed in individual root segments (n=100) in four biological replicates. Bars are averages ± SEs. Statistically significant differences between averages within each group are labeled with different letter based on one-way ANOVA followed by Tukey´s post-hoc test (P<0.05). (D) The mtcle53 mutant line NF10070 has a Tnt1 insert 214 bp upstream of the MtCLE53 ATG start codon. Based on PCR on genomic DNA (gDNA) using MtCLE53-specific forward (fwd) and reverse (rev) primers, homozygous mtcle53 mutants were identified in a segregating population of NF10070 siblings. (E) Relative expression levels of MtCLE53 in mtcle53 and heterozygous siblings based on qRT–PCR of AMF-colonized roots. Bars are averages ± SDs. Significant differences are marked with an asterisk as calculated by two-sided Student’s t-test (P<0.05). (F) Root length colonization by arbuscules and vesicles in mtcle53 and siblings in analyzed root segments (n=160) of eight biological replicates. Bars are averages ± SEs. Statistically significant differences between averages within each group are labeled with a different letter based on one-way ANOVA followed by Tukey’s post-hoc test (P<0.05)

