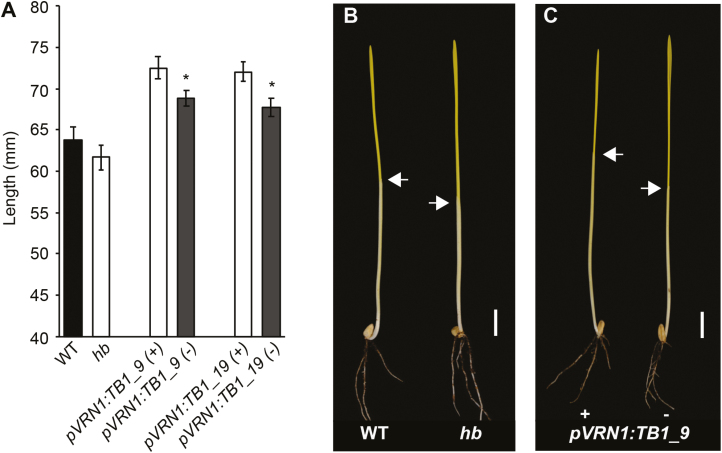
Fig. 5.
Analysis of the effect of TB-D1 on coleoptile length. (A) Coleoptile length measurements for WT (black) and hb (white) lines, and for pVRN1:TB-D1 transgenic lines (grey) relative to the null transgenic control lines (white). Images of representative seedlings for (B) WT and hb and for (C) transgenic pVRN1:TB-D1 transgenic and null control lines. Scale bar=1 cm; white arrows indicate the apical end of the coleoptile. Values are the mean ±SE for 12 biological replicates. * P<0.05.

