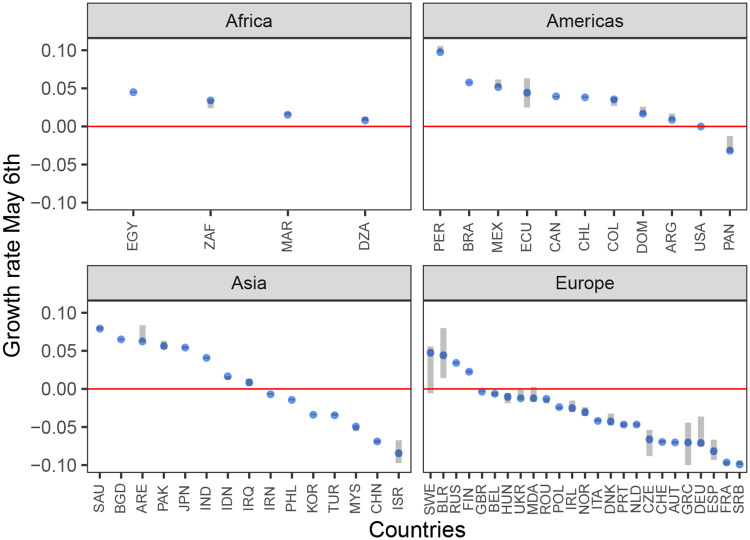
Fig 2. Values of the final exponential growth rates as of May 6 2020.
Blue dots indicate point estimates and grey bars indicate the 99% confidence intervals. The red line delineates exponential growth from exponential decay. Countries below this line have a shrinking epidemic. Country names are indicated by ISO Alpha-3 codes.

