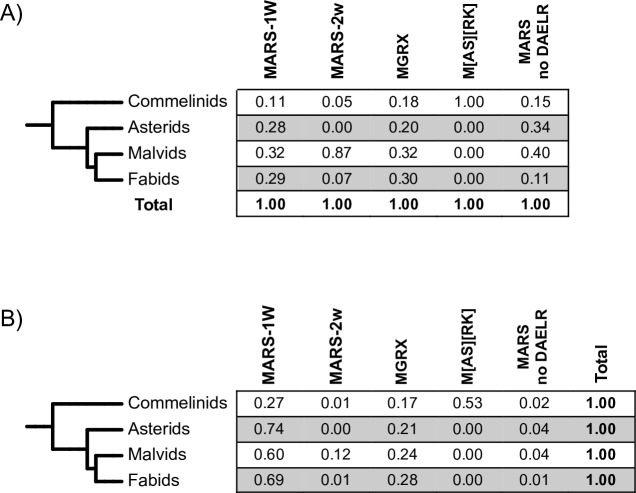
Fig 3. Distribution of LEA3 architectures in plant clades.
The different plant species groups were combined into clades, and numbers were normalized as described in the Materials and Methods. The numbers represent A) the fraction of a plant clade that have one of the architectures, and B) the fraction of a protein architecture within one plant clade.

