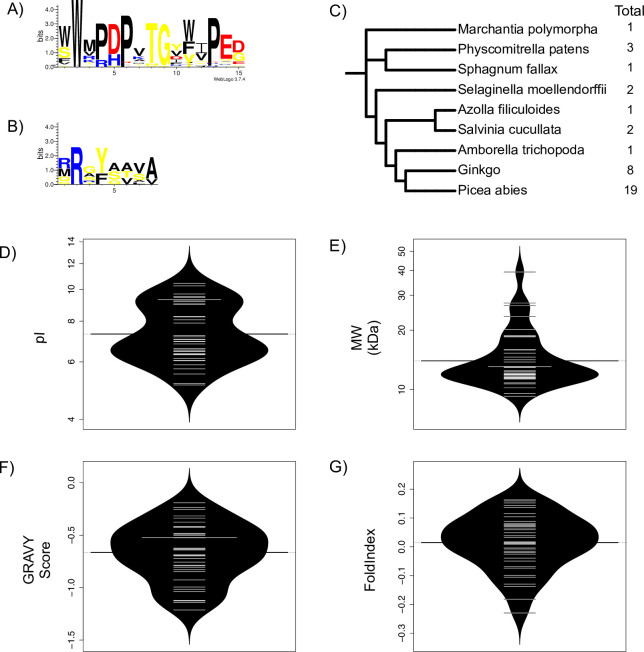
Fig 5. LEA3 proteins in lower plants.
A) W-motif in lower plants in LOGO representation. B) RRGYA4-motif in lower plants in LOGO representation. Amino acids are color-coded by their group type. Blue—positively charged (Lys, Arg, His); red—negatively charged (Asp, Glu); black—hydrophobic (Ala, Val, Leu, Ile, Pro, Phe, Met), yellow—polar (Gly, Ser, Thr, Tyr, Cys, Asn, Gln). The heights of the amino acids correspond to their level of conservation at that position. C) Species tree of LEA3 proteins in lower plants. The right-hand column shows the total number of proteins in each species. Bean plots of the D) isoelectric point (pI), E) molecular weight (MW), F) GRAVY score and G) FoldIndex score of LEA3 proteins in lower plants. The thin bars show the value of an individual protein, the wider black bar shows the mean value of an architecture, and the dotted line shows the mean value of all protein sequences. The violin shape shows the density of the property values.

