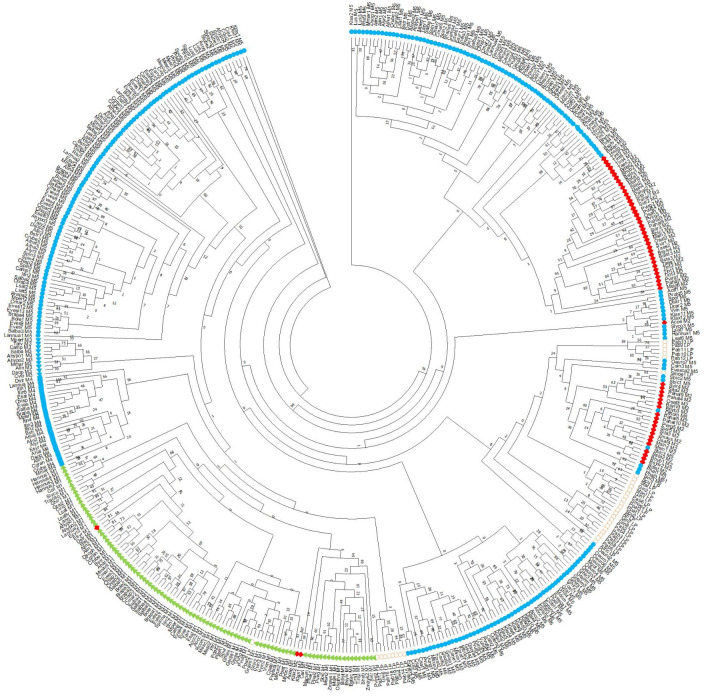
Fig 6. Evolution of LEA3 genes.
Phylogenetic tree of LEA3 proteins from higher and lower plants. The tree was created using RAxML with 1000 bootstrap replicates. The bootstrap values are shown at each node. The architectures are coded as follows: MAaRS-1W, blue circles; MAaRS-2W, blue triangles; MAaRS-no DAELR, blue squares; MGRX, green triangles; M[AS][RK], red diamonds; Lower plants, open circles.

