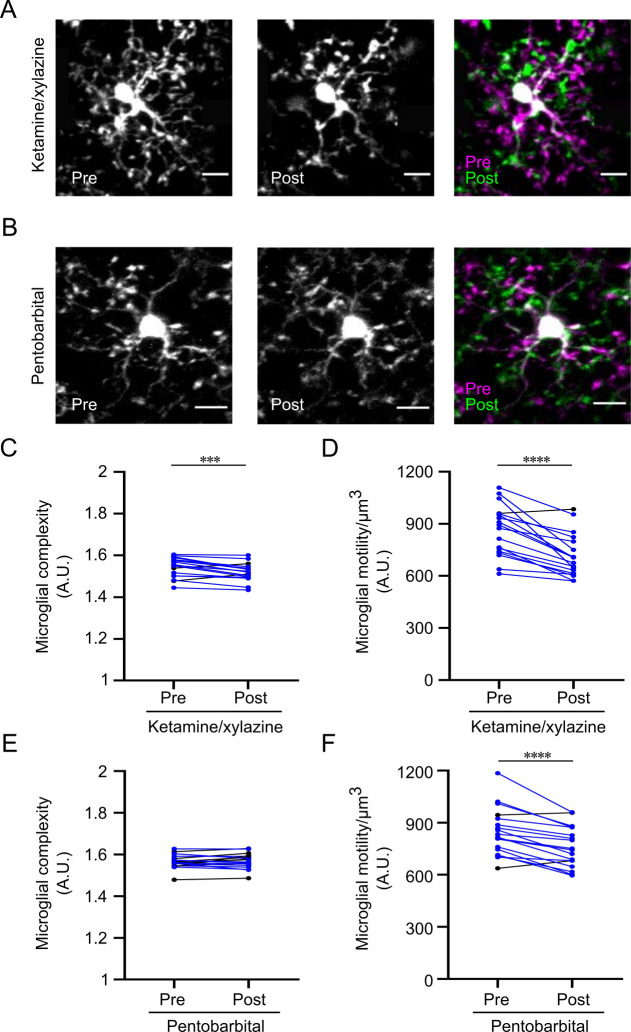
Fig 2. Ketamine/xylazine and pentobarbital anesthesia reduce microglial motility in vivo, while microglial complexity is reduced by ketamine/xylazine only.
(A, B) Individual and color-coded representative images of microglial cells pre- and post- ketamine/xylazine anesthesia (A) and pentobarbital (B) anesthesia. For quality purposes, brightness and contrast were enhanced similarly for the two sets of images. The scale bars equal 10μm. (C, D) Quantification of microglial complexity (C) and motility (D) pre- and post- ketamine/xylazine anesthesia (n = 18 cells, with 3 microglia analyzed per mouse, two-tailed paired t-test). Microglial cells for which these parameters decrease during anesthesia are represented in blue. (E, F) Quantification of microglial complexity (E) and motility (F) pre- and post- pentobarbital anesthesia (n = 18 cells, with 3 microglia analyzed per mouse, two tailed paired t-test). Microglial cells for which these parameters decrease during anesthesia are represented in blue. Bars represent mean±SEM. *p<0.05.

