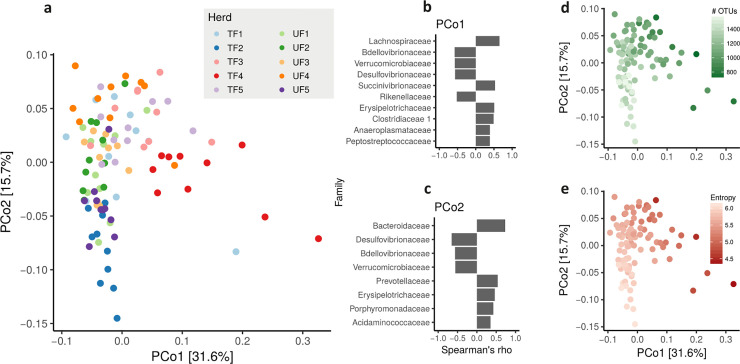
Fig 6. Measures of fecal microbiota composition of Alpine dairy cows.
(a) Principal Coordinate Analysis (PCoA) of the between sample distances measured using Bray-Curtis dissimilarity; Families that drive variability in fecal microbiota composition in the first (b) and second (c) principal component; Sample distance based on the number of observed OTUs (d) and Shannon entropy (e). Colored dots identify cows from ten different herds either fed traditionally (TF) or with unifeed (UF) collected within the Province of Trento, Italy.

