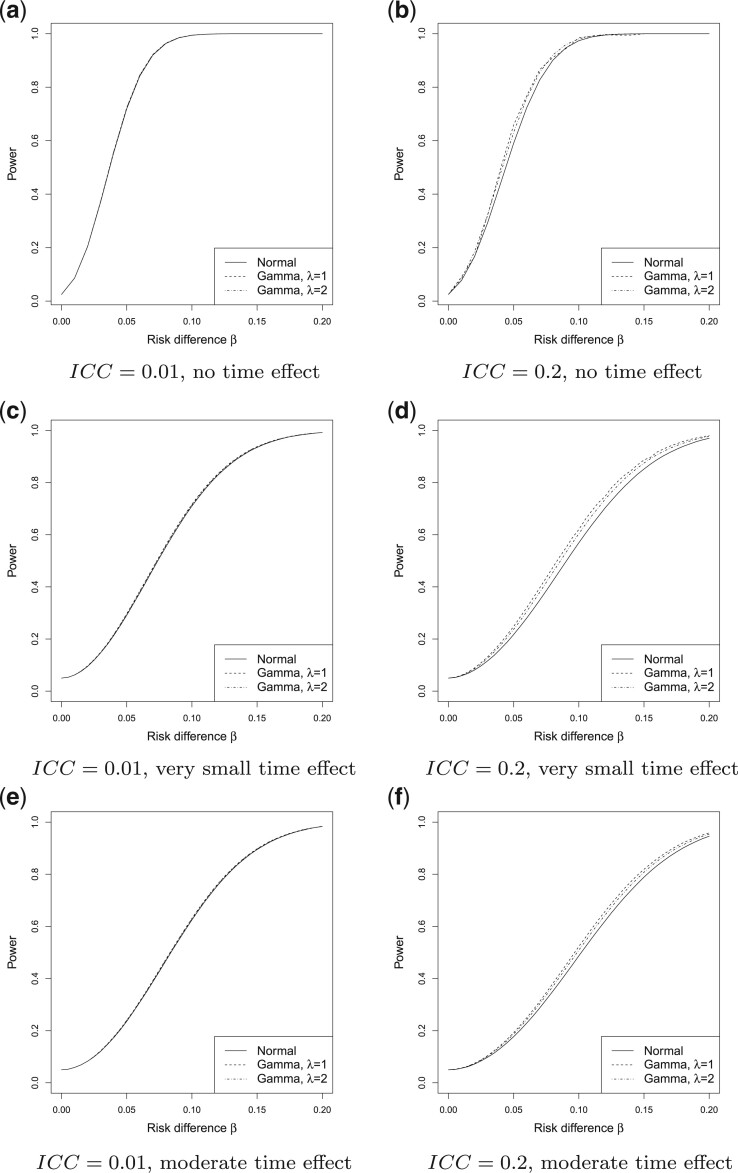
Fig. 2.
Power vs. the risk difference  for different cluster random
effect distributions, with baseline risk
  , number of
steps
  , number of clusters
 , and cluster size
 . For figures in the left column,
 ; while for figures in the
right column,
  . There are no time effects
(
 ) in the first row, very small
time effects (
 ) in the second row, and
moderate time effects (
 ) in the third row.

