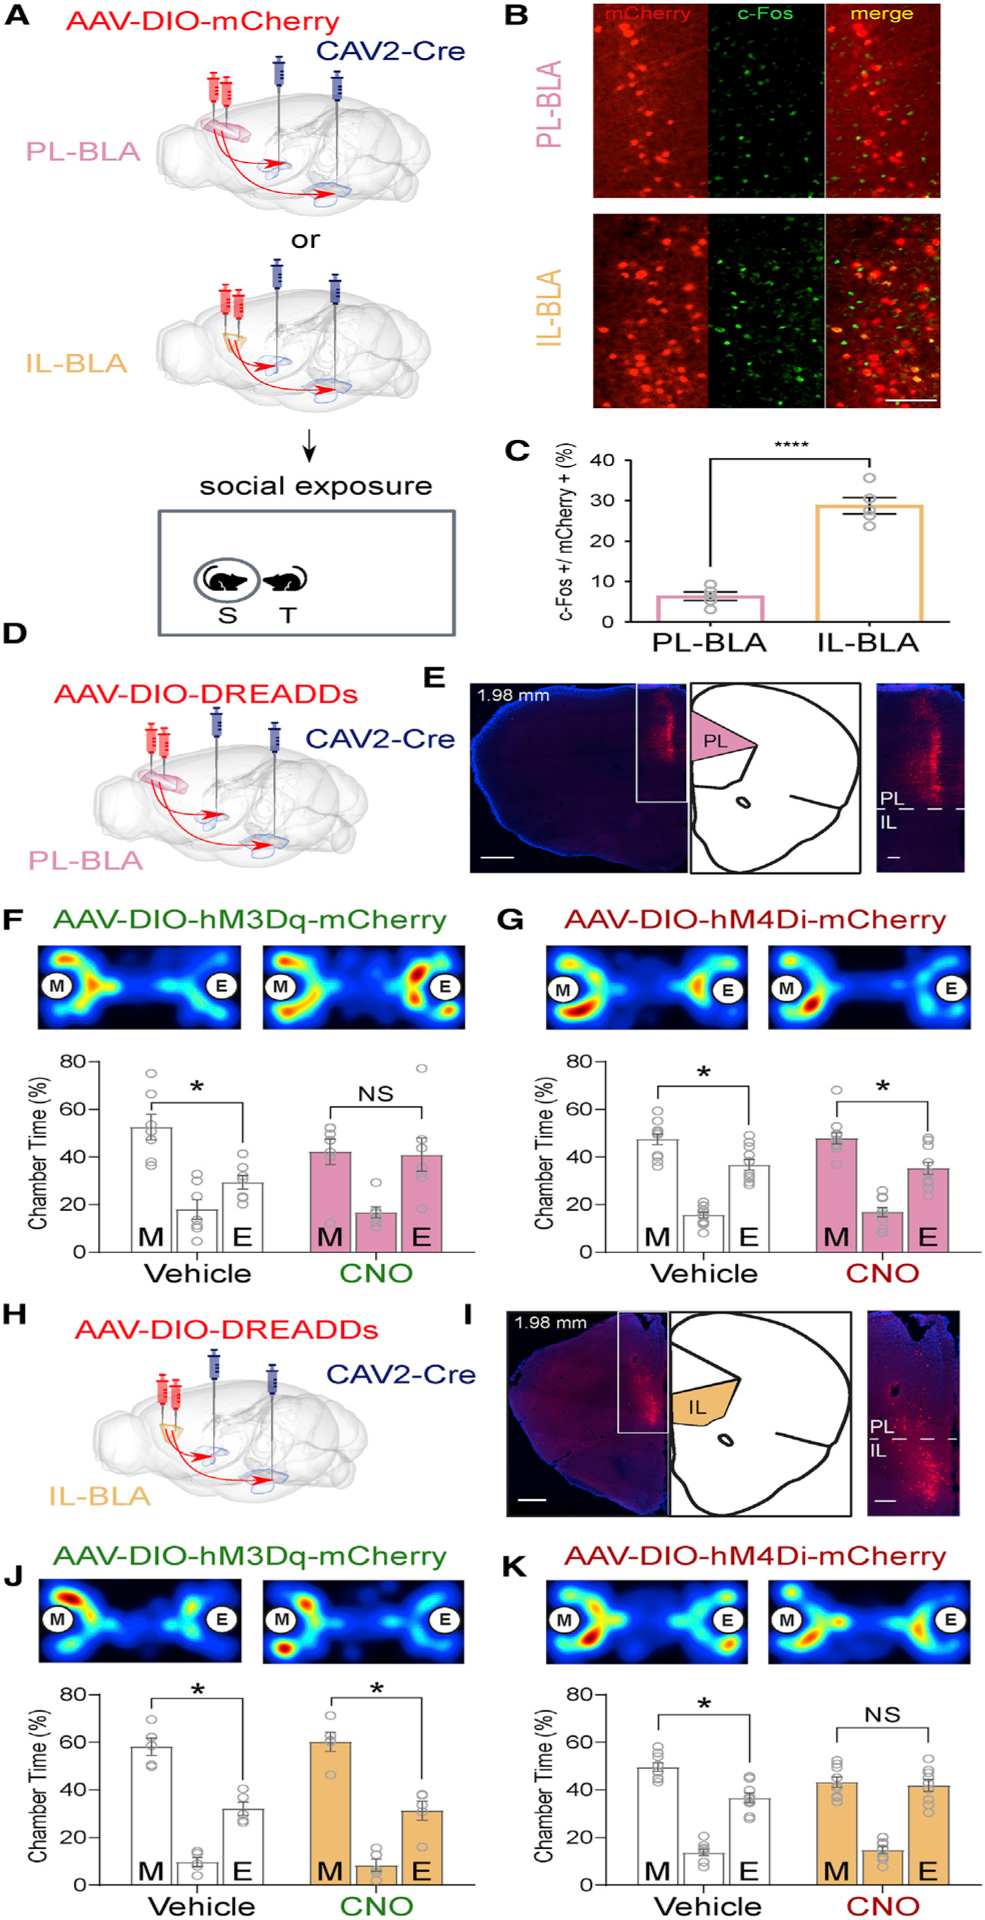
Figure 1. Infralimbic Cortex-to-Basolateral Amygdala Circuitry Is More Active in Response to Social Cues, and Activation of Prelimbic Cortex or Inhibition of Infralimbic Cortex-to-Basolateral Amygdala Circuitry Impairs Social Behavior.

(A) Experimental design for quantification of social exposure-activated neurons in the prelimbic cortex (PL) and infralimbic cortex (IL).
(B) Representative images of reporter mCherry (red) and c-Fos (green) double labeling in the PL or IL (yellow). Scale bar: 100 μm.
(C) Quantification of c-Fos+ neurons in the mCherry+ neuronal population. n = 5 for PL, n = 5 for IL.
(D) Schematic for DREADD activation (AAV-DIO-hM3Dq-mCherry) or inhibition (AAV-DIO-hM4Di-mCherry) of PL-basolateral amygdala (BLA) circuit.
(E) Representative image and magnification of white box area of reporter (mCherry) expression in the PL. Scale bars: 500 μm and 100 μm.
(F and G) Representative heatmaps and quantification of three-chamber social approach test with PL-BLA DREADDs. n = 7 for hM3Dq (F), n = 11 for hM4Di (G).
(H) Schematic for DREADD activation (AAV-DIO-hM3Dq-mCherry) or inhibition (AAV-DIO-hM4Di-mCherry) of IL-BLA circuit.
(I) Representative image and magnification of white box area of more than 80% of the reporter (mCherry) expression in the IL. Scale bars: 500 μm and 100 μm.
See also Figure S1B for quantification.
(J and K) Representative heatmaps and quantification of three-chamber social approach test with IL-BLA DREADDs. n = 5 mice in hM3Dq group (J) and n = 9 mice in hM4Di group (K).
The letters M and E inside circles and inside bars indicate a stimulus mouse inside a tube and an empty tube, respectively. For heatmaps, warmer colors denote where the mice spent more time. Groups were compared using independent-samples t tests in (C), and paired-samples t tests were used to compare time spent in the chambers containing a mouse in a tube and an empty tube separately for each group in (F, G, J, and K). Data are represented as mean ± SEM. *p < 0.05 and ****p < 0.0001. See also Figures S1C–S1E for fiuorophore-only control experiments.
