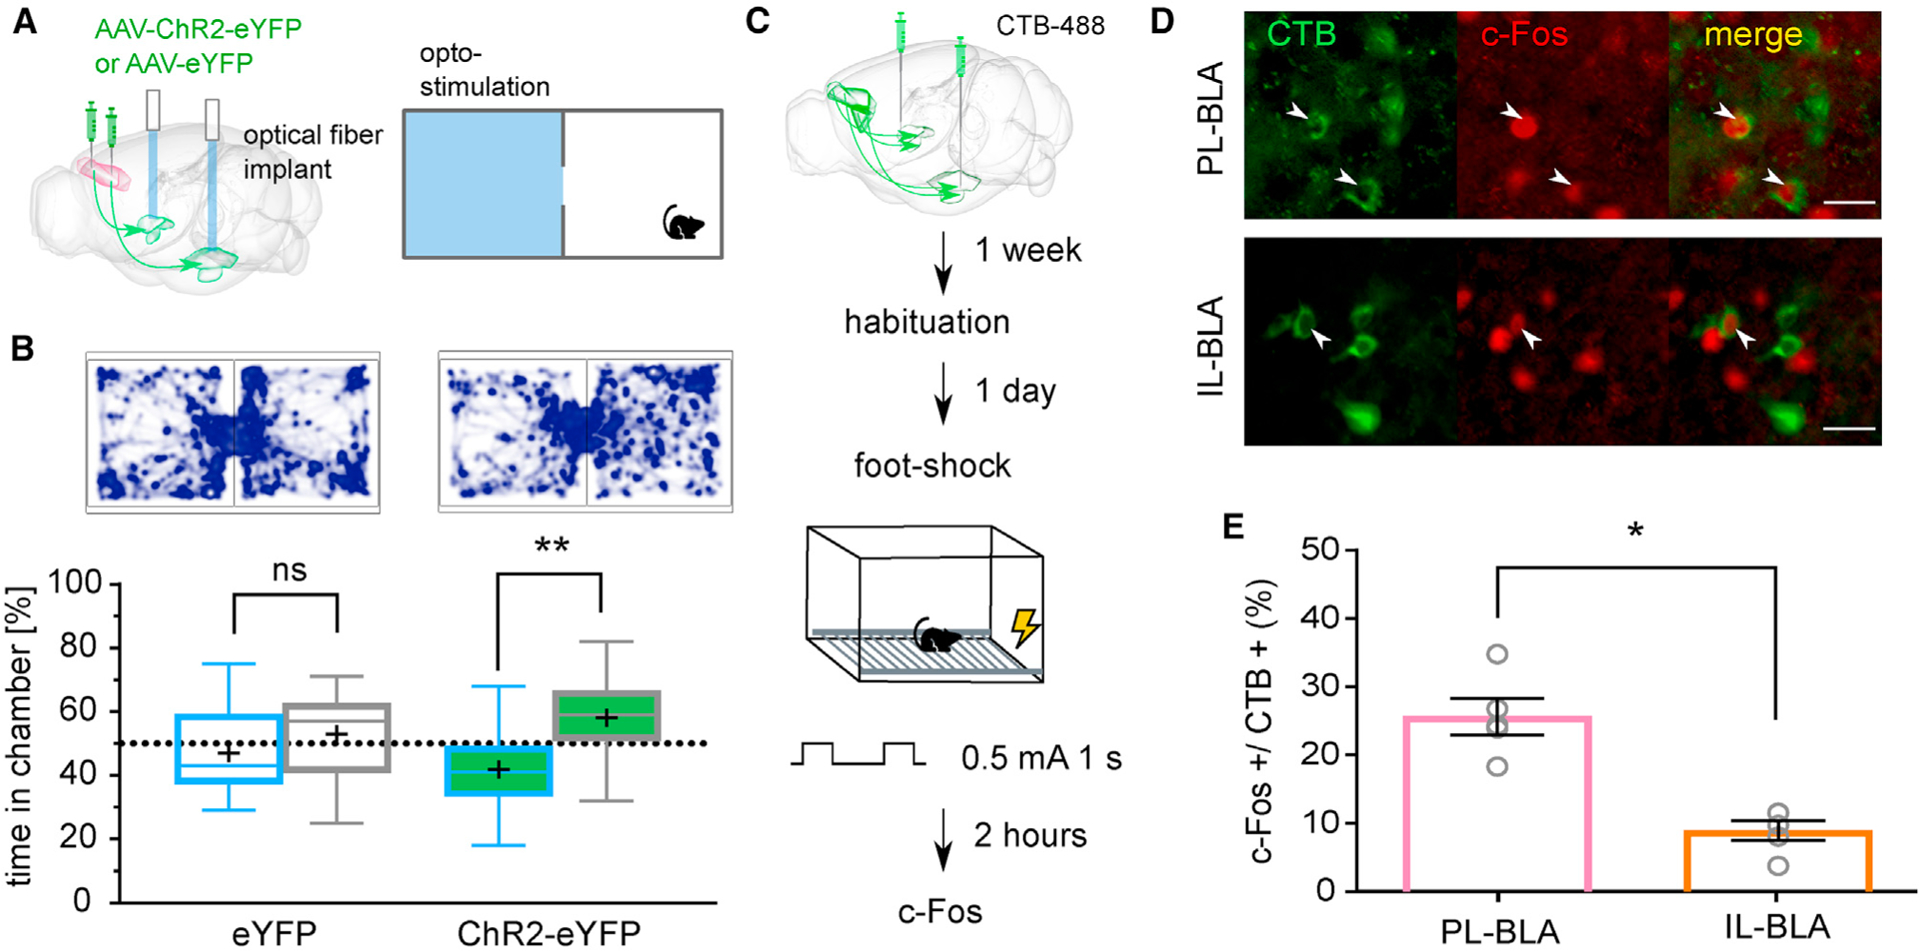
Figure 3. Optogenetic Activation of Negative-Valence PL-to-BLA Circuitry Produce Behavioral Avoidance.

(A) Top: cartoon of the two-chamber real-time place preference (RTPP) apparatus where one side (in blue) is paired with optogenetic light stimulation.
(B) Representative track map and box (25%, median, 75%) and whisker (maximum, minimum) plot show results for RTPP, where (+) denotes the mean. ChR2-expressing mice spent less time in the light-stimulation paired (blue) than non-stimulated paired chamber, while control mice showed no chamber preference. n = 14 for control mice and n = 21 for ChR2-expressing mice.
(C) Diagram of injection to label neurons that project to the BLA and time course of activating negative-valence neurons.
(D) Representative images showing CTB-488 expression (green) on the cell membrane and c-Fos (red) staining the nucleus. White arrows indicate double-labeled cells. Scale bar: 25 μm.
(E) Quantification of CTB+ cells that are also c-Fos+ in PL and IL. Bar graph is represented as mean ± SEM n = 5 for PL, n = 5 for IL.
Paired-samples t test was used to compare between groups. *p < 0.05 and **p < 0.01. See also Figure S3 relating to these experiments.
