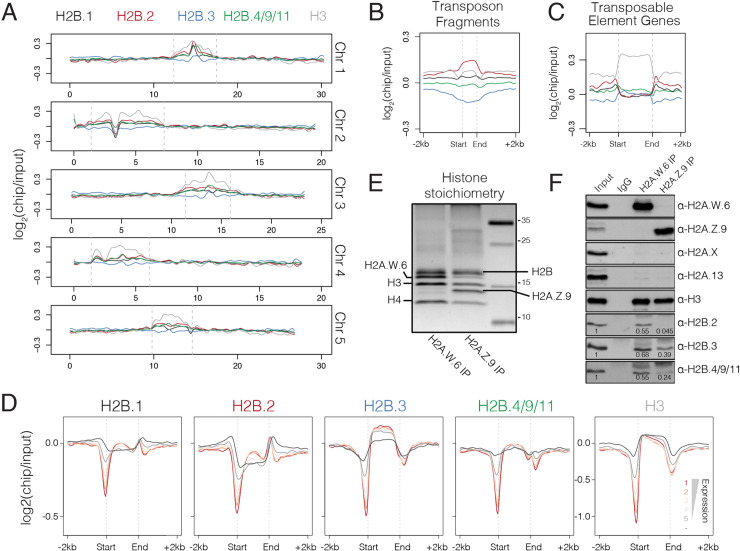
Fig 4. Genomic distribution of somatic Arabidopsis H2Bs.
(A) Chromosomal distribution of somatic H2Bs alongside histone H3 over each of the five Arabidopsis chromosomes calculated in 100 kb bins. Plotted is the ChIP-seq log2 enrichment relative to input. Pericentromeric regions are indicated by dashed grey lines. (B-C) Distribution of somatic H2Bs and histone H3 over transposon fragments (B) and transposable element genes (C). Plotted is the ChIP-seq log2 enrichment relative to input. (D) Distribution of somatic H2Bs and histone H3 over genes grouped by their level of expression in Arabidopsis seedlings. Each group is colour coded using the scheme shown with non-expressed genes shown in dark grey. (E) Silver stained gel of immunoprecipitated H2A.W.6 and H2A.Z.9 mono-nucleosomes confirms histone stoichiometry. Identities of protein bands are indicated. (F) Western blotting analysis of samples in panel E with indicated antibodies. Enrichment of H2Bs was calculated relative to input and normalized to H3 in each sample.

