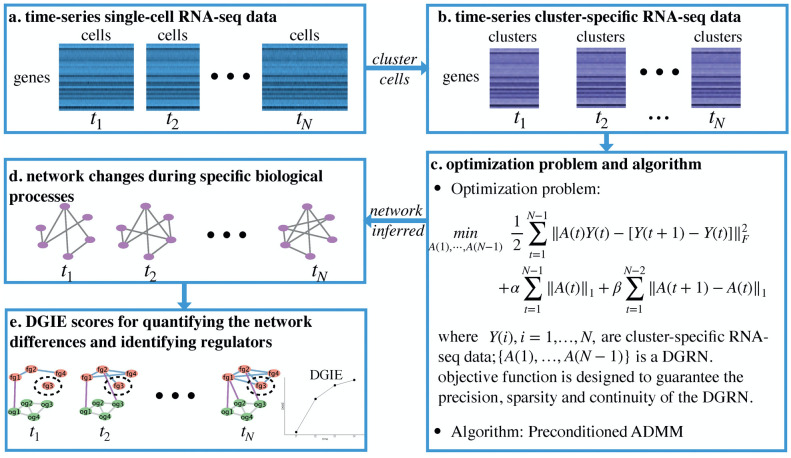
Fig 1. Framework of scPADGRN.
(a) Time-series scRNA-seq data. Several cells are sequenced at each time point. (b) Time-series cluster-specific RNA-seq data. The same clusters exist at each time point. (c) Optimization problem and algorithm. Three features of DGRNs are considered in the optimization problem: precision, sparsity and continuity. The PADMM method is used to solve the optimization problem. (d) Network changes during specific biological processes. The purple nodes represent the genes involved in the same biological processes. Several links change during a given process. (e) DGIE scores for quantifying the network differences and identifying regulators. The nodes shown in pink are functional genes (fg). The nodes shown in green are other genes (og). The DGIE score measures the activity state of the functional genes. The blue and purple links are used to compute the DGIE scores. In this toy model, the DGIE score increases over time since the interactions of the functional genes become more intense. The circled gene, fg3, is the identified key transcriptional regulator.

