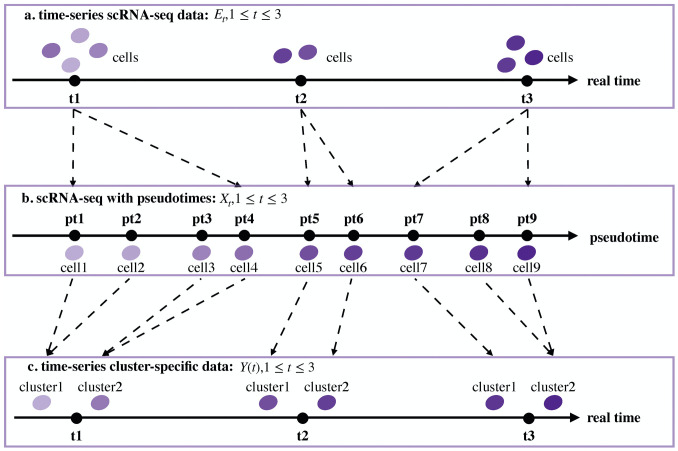
Fig 2. Clustering process for data conversion.
(a) Time-series scRNA-seq data Et, 1 ≤ t ≤ 3. Several cells are sequenced at each time point. (b) Corresponding scRNA-seq data Xt, 1 ≤ t ≤ 3, under pseudotimes. The cells are arranged on a pseudotime line. (c) Time-series cluster-specific data. The same clusters exist at each time point on the real timeline.

